 Stay
Stay 
Trading Conditions
Products
Tools


The EUR/USD currency pair unexpectedly rose during the U.S. trading session on Wednesday. The increase in the U.S. dollar was surprising, as there was no positive news to support it—quite the opposite. The two most significant macroeconomic reports for the day — U.S. retail sales and industrial production — came in weaker than forecast. Retail sales fell by 0.9% (vs. -0.7% expected), and industrial production dropped by 0.2% (vs. +0.1% forecast). Thus, the dollar had every reason to continue its five-month decline. Yet, something inexplicable happened.
Could Donald Trump have announced tariff reductions or cancellations? No. On the contrary, the U.S. president once again lashed out at the European Union for "still not offering him a fair trade deal." So, the decline of the EUR/USD pair was quite strange. From a technical perspective, the price broke below another trend line, and the Kijun-sen line was tested. If this line is breached, the dollar could continue rising toward the Senkou Span B line on technical grounds. Remember that the dollar is extremely oversold and cannot fall forever.
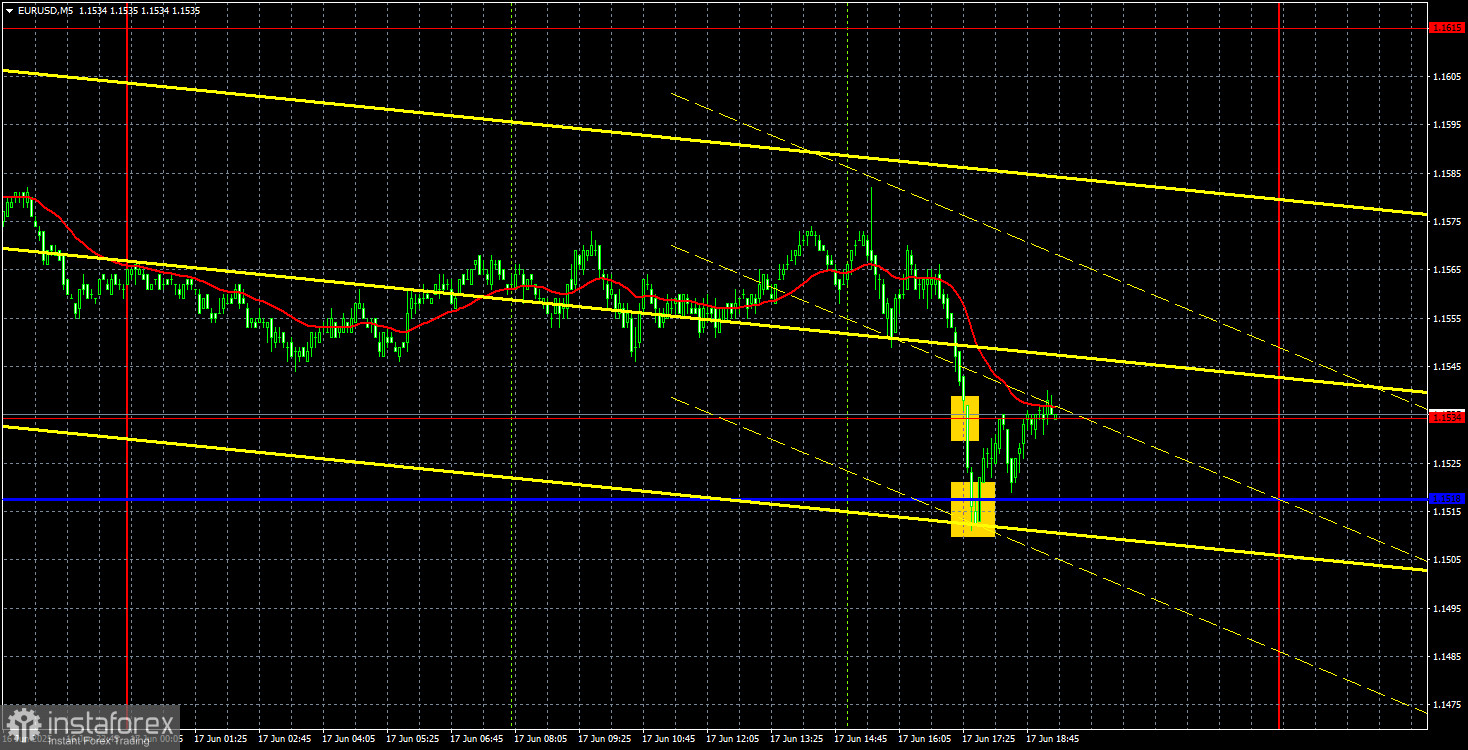
On the 5-minute timeframe, trading signals formed at the very end of the move. Unfortunately, the movement started from an area without clear levels or lines. By the end of the day, the pair was in the 1.1518–1.1534 zone. Depending on which boundary of this range the price breaks through, the dollar will either rise or fall on Wednesday. It's quite possible that what we saw yesterday was the market's early reaction to the upcoming Federal Reserve meeting.
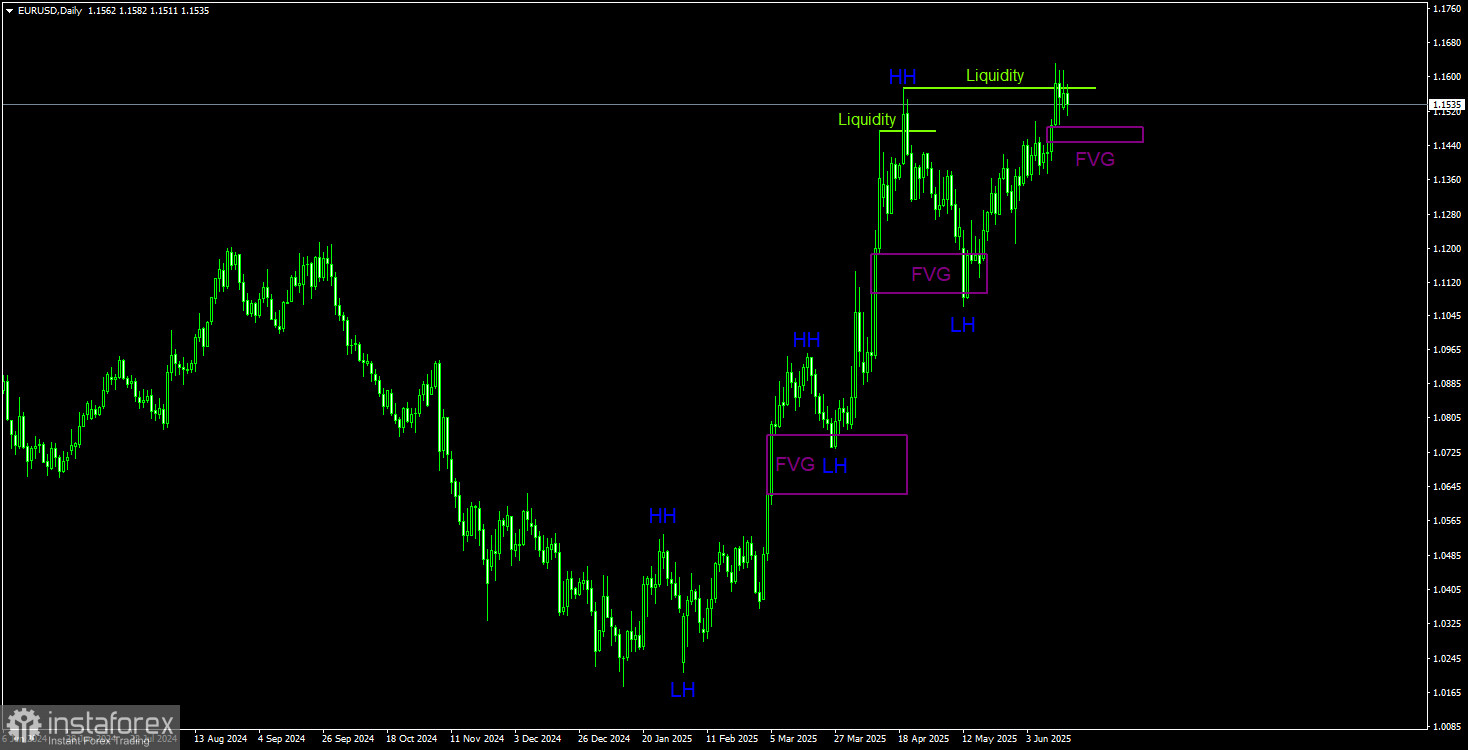
In the long term, we see a clear uptrend. Of course, this uptrend will end someday, but the only current signal for a potential drop is the liquidity grab from the last higher high (HH). On the bullish side, we have a bullish Fair Value Gap (FVG) zone. A bounce from this zone, confirmed on lower timeframes, would indicate the resumption of the euro's growth. The uptrend remains valid as long as the price stays above the 1.1100 level. This means the dollar could even strengthen by a few hundred points without changing the broader trend. Fundamentally, the backdrop continues to work against the U.S. dollar.
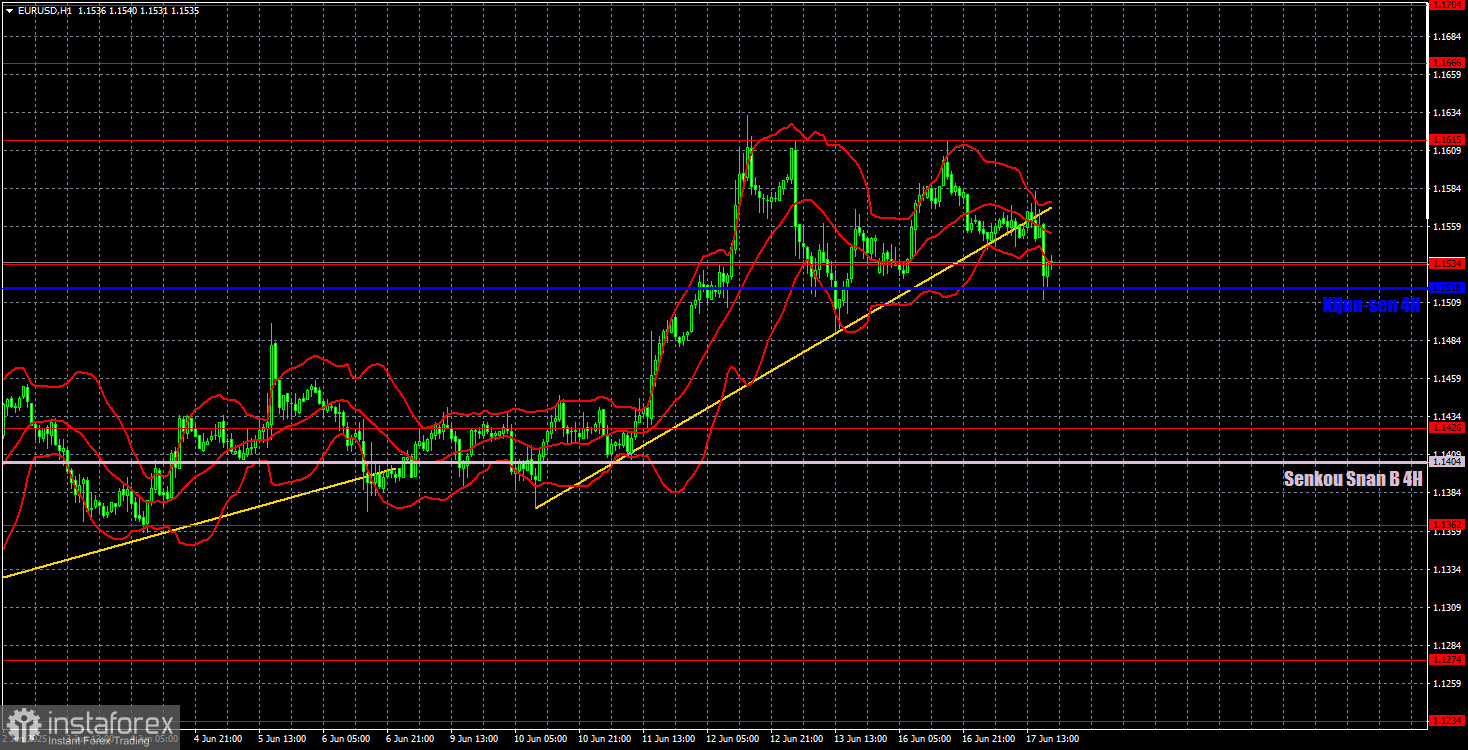
In the hourly timeframe, EUR/USD maintains a local uptrend despite breaking through and surpassing all known ascending trend lines. For instance, yesterday, the price failed to settle below the critical Kijun-sen line. As before (over the past five months), the market reacts mainly to events surrounding Trump, his decisions, and the trade war. The full-blown Middle East war has been added to this already "wonderful and positive" mix. Positive news is nonexistent, while there's no shortage of negative developments. Therefore, the dollar continues to depreciate, which greatly benefits Trump.
For June 18, we highlight the following trading levels: 1.1092, 1.1147, 1.1185, 1.1234, 1.1274, 1.1362, 1.1426, 1.1534, 1.1615, 1.1666, 1.1704, 1.1750. Also relevant are the Senkou Span B line (1.1404) and the Kijun-sen line (1.1518). Ichimoku lines may shift during the day, so this should be considered when identifying signals. Don't forget to set a Stop Loss to break even after a 15-pip move in the right direction — this helps protect against false signals.
There will only be minor reports from the EU and the U.S. throughout Wednesday. However, the Fed meeting results will be announced in the evening. We believe yesterday's dollar strength is tied specifically to that upcoming event—and nothing else. We do not expect the Fed to offer any support for the U.S. dollar, but it's better to wait for the official outcome before drawing conclusions. A break below the critical line would allow the pair to continue moving south.
InstaForex analytical reviews will make you fully aware of market trends! Being an InstaForex client, you are provided with a large number of free services for efficient trading.


