 Stay
Stay 
Trading Conditions
Products
Tools


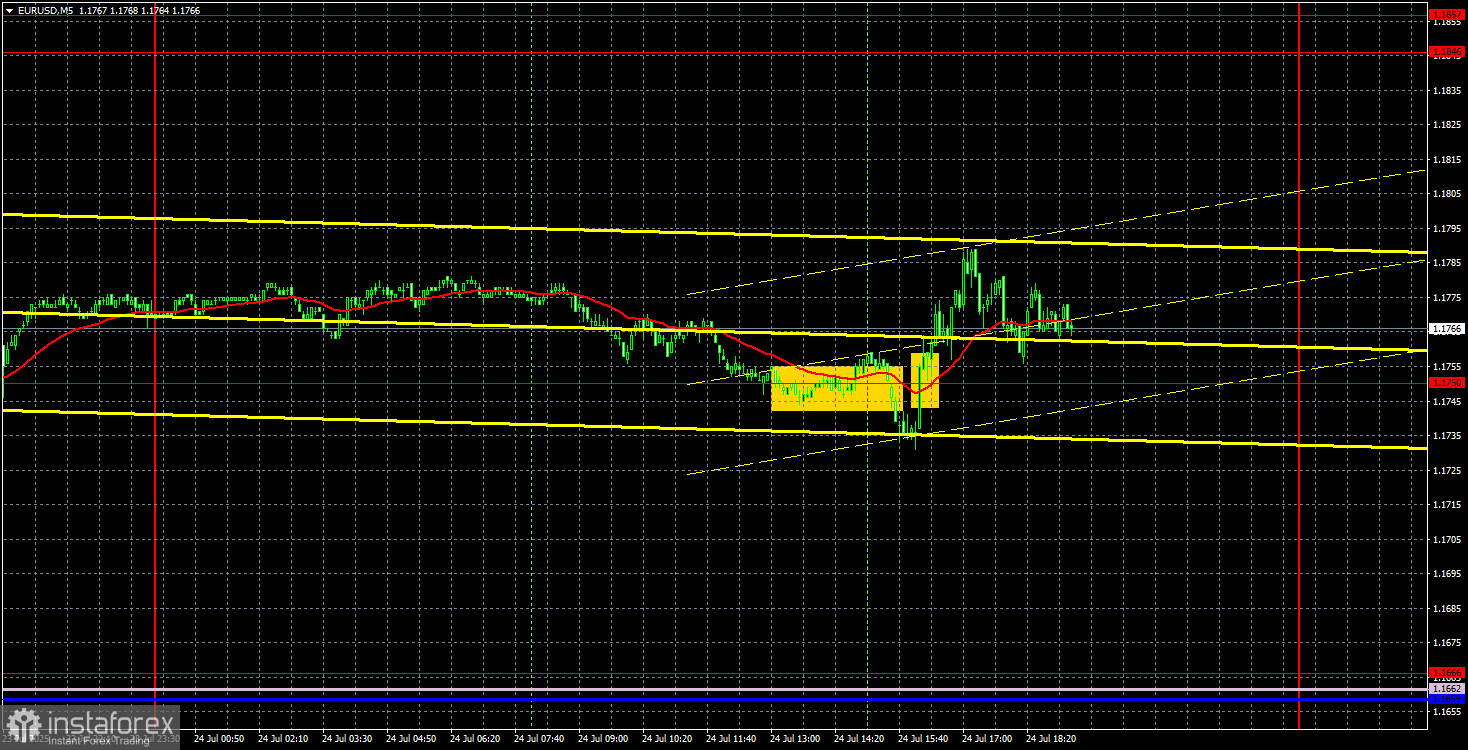
On Thursday, the EUR/USD currency pair exhibited astonishingly low volatility and a complete unwillingness to move in any clear direction. Many traders were expecting active movements during the day, as it was one of the few days this week with macroeconomic releases. However, six business activity indices from the services and manufacturing sectors of Germany, the EU, and the U.S. failed to trigger any significant market reaction. We had warned yesterday that the response might be extremely muted. The same applies to the European Central Bank meeting: no important decisions were made, and interest rates remained unchanged. In short, the market had nothing to react to. Although there was a brief emotional spike, it had no lasting impact, and the total daily volatility amounted to only 60 pips.
From a technical perspective, everything looks orderly and consistent. The pair continues its steady upward movement after exiting the descending channel. The pace is slow, but the direction is correct. As we mentioned earlier, Donald Trump's policies continue to have a destructive impact on the U.S. dollar.
In the 5-minute time frame, two trading signals were generated yesterday, both of which should have been ignored. They appeared during the ECB meeting results, and as we noted, such periods are often prone to emotional surges unrelated to logical market movements.
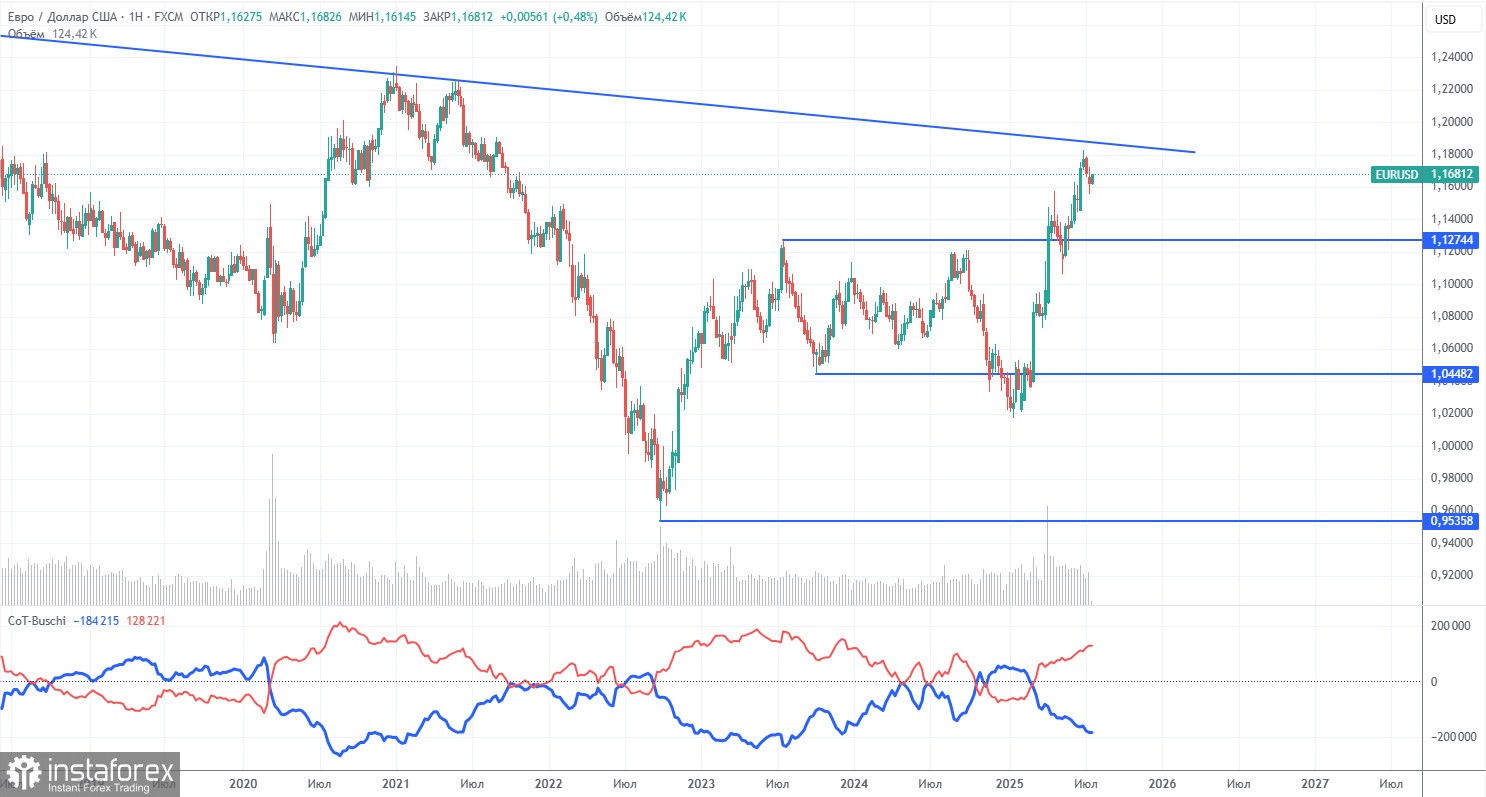
The latest COT report is dated July 15. As shown in the chart above, the net position of non-commercial traders had been bullish for a long time. Bears only barely gained the upper hand at the end of 2024—and then quickly lost it. Since Trump took office, the dollar has been the only currency to fall. While we can't say with 100% certainty that the U.S. currency will continue to decline, current global developments suggest that scenario.
We still do not see any fundamental reasons for the strengthening of the euro; however, one very strong factor remains for the dollar's continued decline. The global downtrend persists—but does it matter now where the price has moved over the past 16 years? Once Trump ends his trade wars, the dollar may resume growth—but will Trump ever end them? And when?
The position of the red and blue indicator lines still points to a bullish trend. During the latest reporting week, the number of long positions in the "Non-commercial" group increased by 1,000 contracts, while short positions decreased by 6,600. As a result, the net position increased by 7,600 contracts.
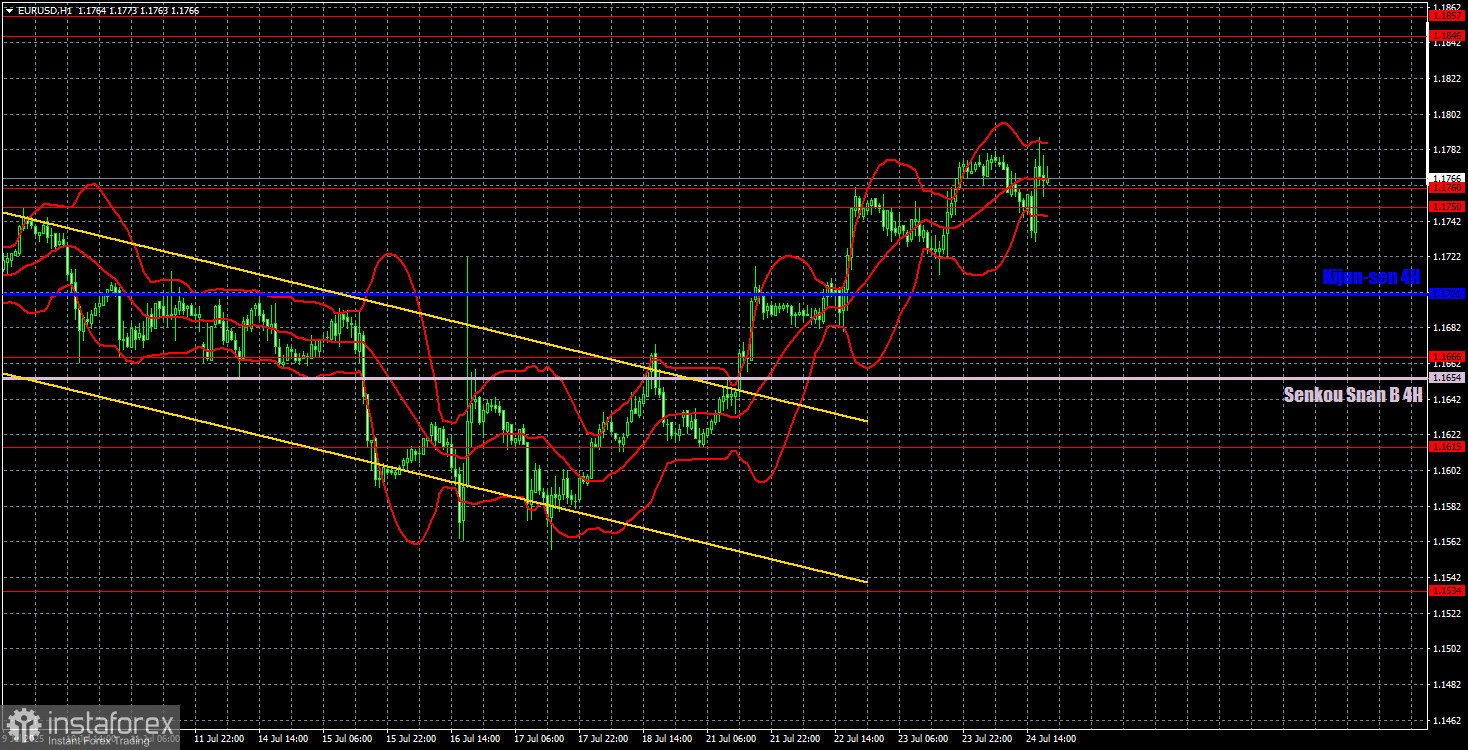
In the hourly time frame, EUR/USD continues to form a new uptrend. Donald Trump is still raising tariffs, introducing new ones, and the prospect of signing any trade deal with those on his "blacklist" seems increasingly unlikely. Without trade deals, the trade war escalates further, and even with deals, Trump's tariffs remain in force. His conflict with Powell is another factor contributing to dollar weakness in 2025.
For July 25, we highlight the following levels for trading: 1.1092, 1.1147, 1.1185, 1.1234, 1.1274, 1.1362, 1.1426, 1.1534, 1.1615, 1.1666, 1.1750, 1.1846–1.1857, along with the Senkou Span B (1.1662) and Kijun-sen (1.1701) lines. The Ichimoku indicator lines may shift during the day, so this should be considered when identifying signals. Don't forget to place your Stop Loss at breakeven once the price moves 15 pips in your direction. This will help protect you from potential losses if the signal turns out to be false.
On Friday, no significant events are scheduled in the Eurozone, except for the release of the German business climate index. In the U.S., the durable goods orders report will be released—but it's just one of several reports for the entire day.
InstaForex analytical reviews will make you fully aware of market trends! Being an InstaForex client, you are provided with a large number of free services for efficient trading.


