 Stay
Stay 
Trading Conditions
Products
Tools


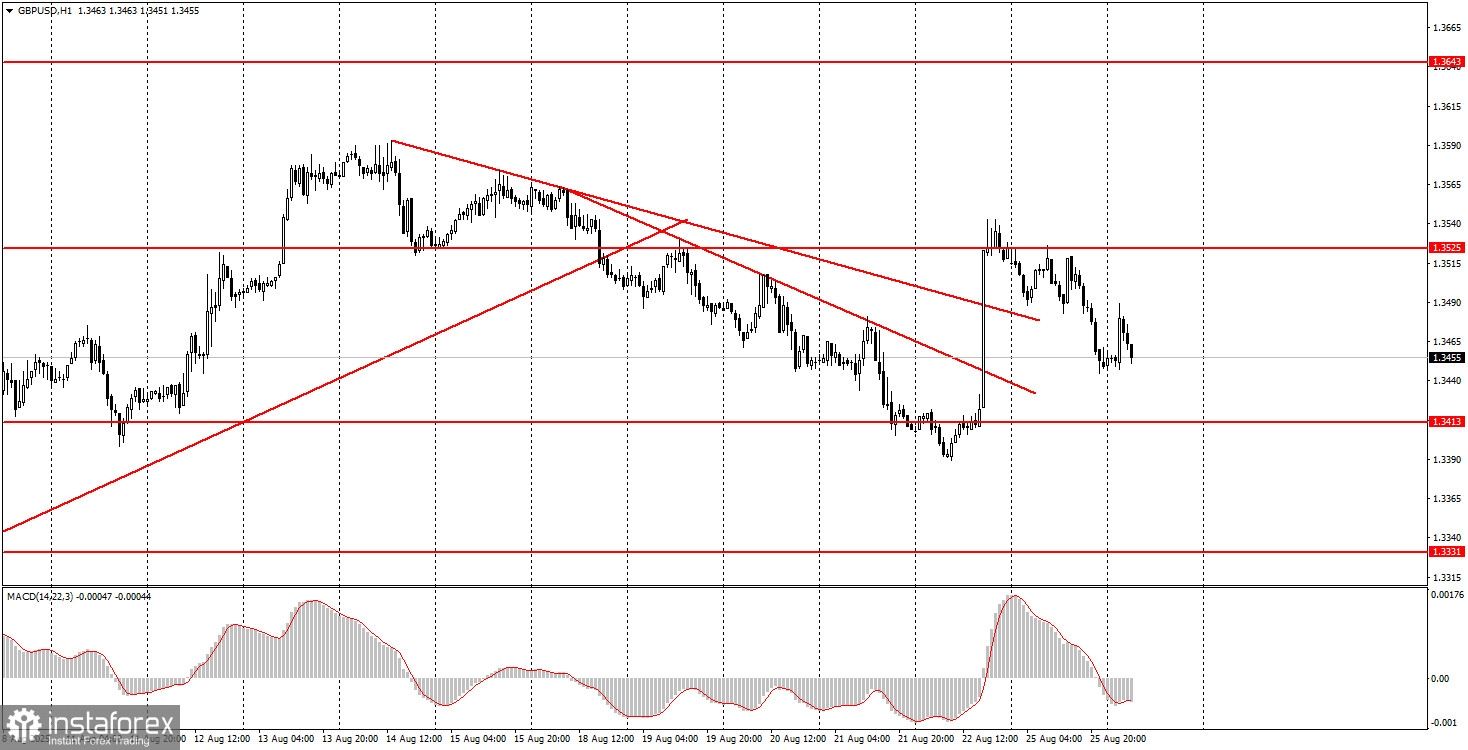
On Monday, the GBP/USD pair also traded lower, which looks somewhat unusual. There were no important reports or events in either the UK or the US on the first trading day of the week, and the pair's main decline came during the evening session. Recall that last week, the pair broke through two descending trendlines at once, so the trend shifted to bullish. Novice traders should remember that the technical picture can change, and signals can be false. At present, we expect growth to resume, but opening long positions only makes sense after buy signals form on the 5-minute timeframe. If there are no signals and the price continues to fall, buying the British pound under current circumstances is not advisable. Today, a fairly important report is set to be released in the US, which could help the pound resume its upward move, but at the same time, it could also support the US dollar.
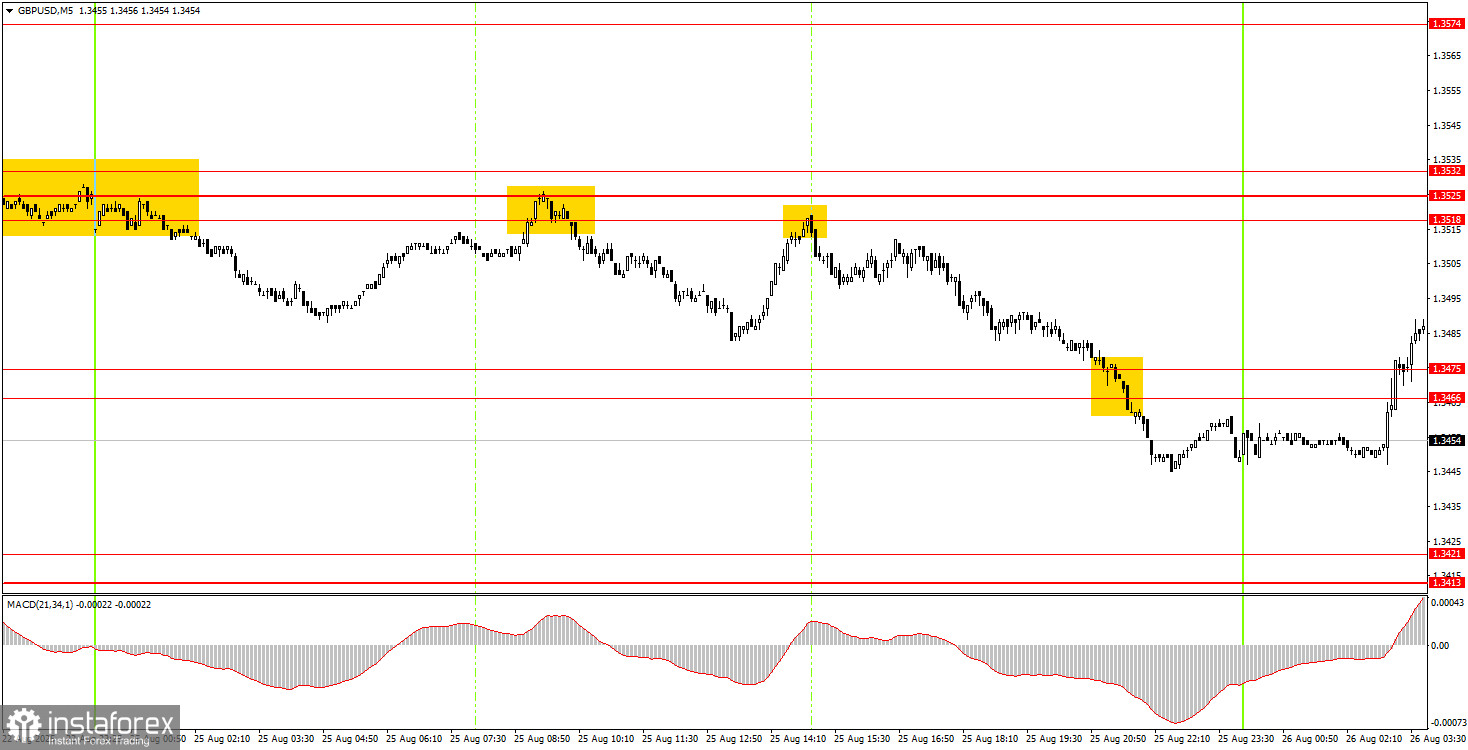
On the 5-minute timeframe, four trading signals formed on Monday. The price rebounded three times from the 1.3518–1.3532 area, so traders had plenty of opportunities to open short positions. Ultimately, the pair reached the nearest target at 1.3466–1.3475 and even broke through it. Overnight, the price generated a buy signal, so short trades should have been closed manually on Monday evening or by Stop Loss in profit overnight.
On the hourly chart, GBP/USD shows that the downtrend is over and a new uptrend is beginning. The fundamental and macroeconomic background has not improved in favor of the dollar enough to expect further strengthening. Thus, as before, we are only looking north. Any news about the escalation of the trade war, de-escalation of the Ukraine conflict, or Trump's pressure on the Federal Reserve will mean a potential new decline for the US dollar.
On Tuesday, GBP/USD may extend its decline since two sell signals have formed around the 1.3466–1.3475 area. At the same time, the overall technical picture on the hourly chart points to a more likely rise. For long positions, a new consolidation above the 1.3466–1.3475 area is required.
On the 5-minute chart, trading can now be done at the levels: 1.3102–1.3107, 1.3203–1.3211, 1.3259, 1.3329–1.3331, 1.3413–1.3421, 1.3466–1.3475, 1.3518–1.3532, 1.3574–1.3590, 1.3643–1.3652, 1.3682, 1.3763.
For Tuesday, no major events are scheduled in the UK, while in the US, traders should pay attention to the durable goods orders report.
Support and Resistance Levels: These are target levels for opening or closing positions and can also serve as points for placing Take Profit orders.
Red Lines: Channels or trendlines indicating the current trend and the preferred direction for trading.
MACD Indicator (14,22,3): A histogram and signal line used as a supplementary source of trading signals.
Important Events and Reports: Found in the economic calendar, these can heavily influence price movements. Exercise caution or exit the market during their release to avoid sharp reversals.
Forex trading beginners should remember that not every trade will be profitable. Developing a clear strategy and practicing proper money management are essential for long-term trading success.
InstaForex analytical reviews will make you fully aware of market trends! Being an InstaForex client, you are provided with a large number of free services for efficient trading.


