 Stay
Stay 
Trading Conditions
Products
Tools


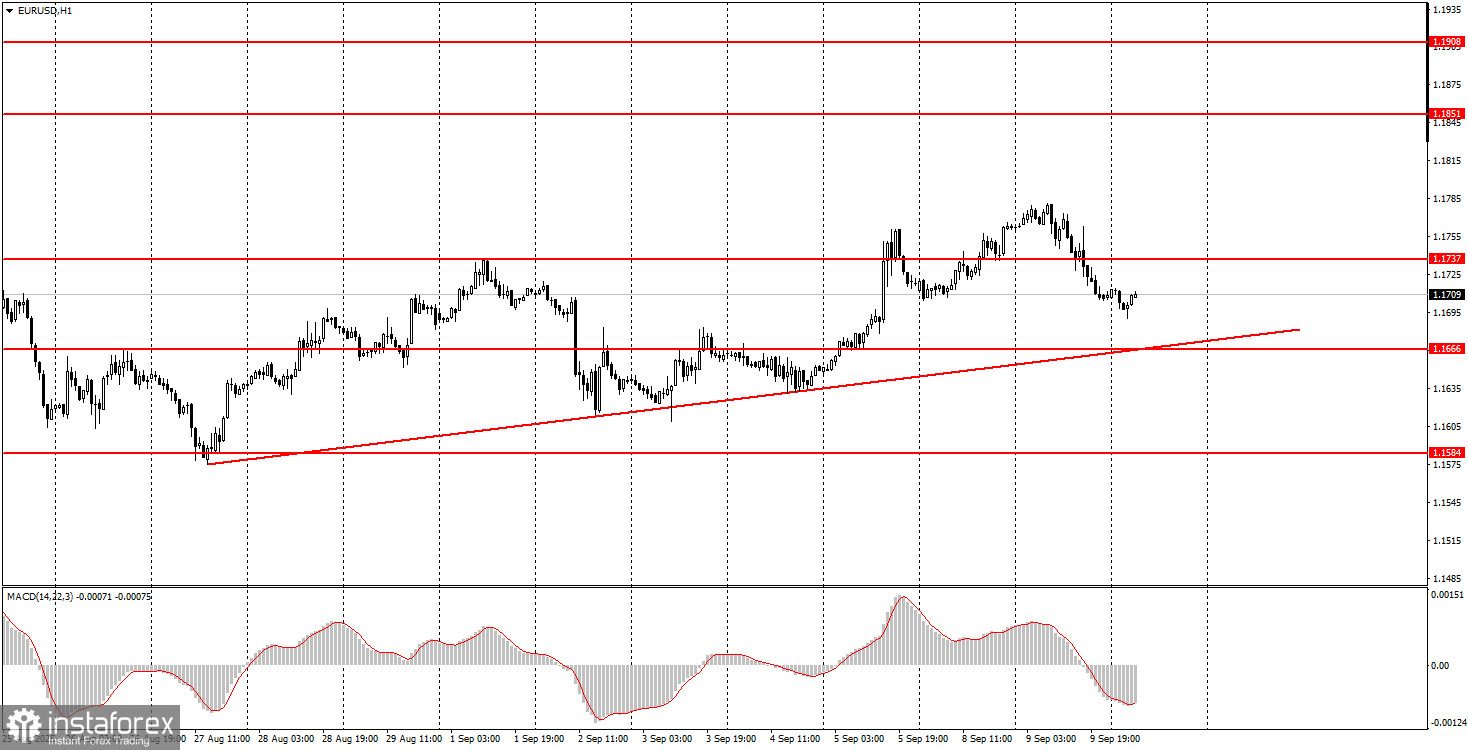
The EUR/USD currency pair on Tuesday showed a downward move for inexplicable reasons. Recall that the annual NonFarm Payrolls report was supposed to be released that day—a report that initially bore nothing good for the US dollar. In the end, the annual Nonfarm figure was revised down by almost 1 million jobs. So, the dollar had excellent chances to continue its decline yesterday. But instead, we saw it rise. It's important to note that trading is taking place on the 5-minute chart. In this trading style (intraday), trades rarely depend on the nature of macroeconomic events. In other words, two trading signals were formed yesterday that could have been executed regardless of the NonFarm Payrolls report. The macroeconomic backdrop only adjusts technical analysis. Therefore, nothing is alarming about the dollar strengthening. The move simply looked odd and illogical. On the hourly chart, the uptrend is still in place as indicated by the trendline.
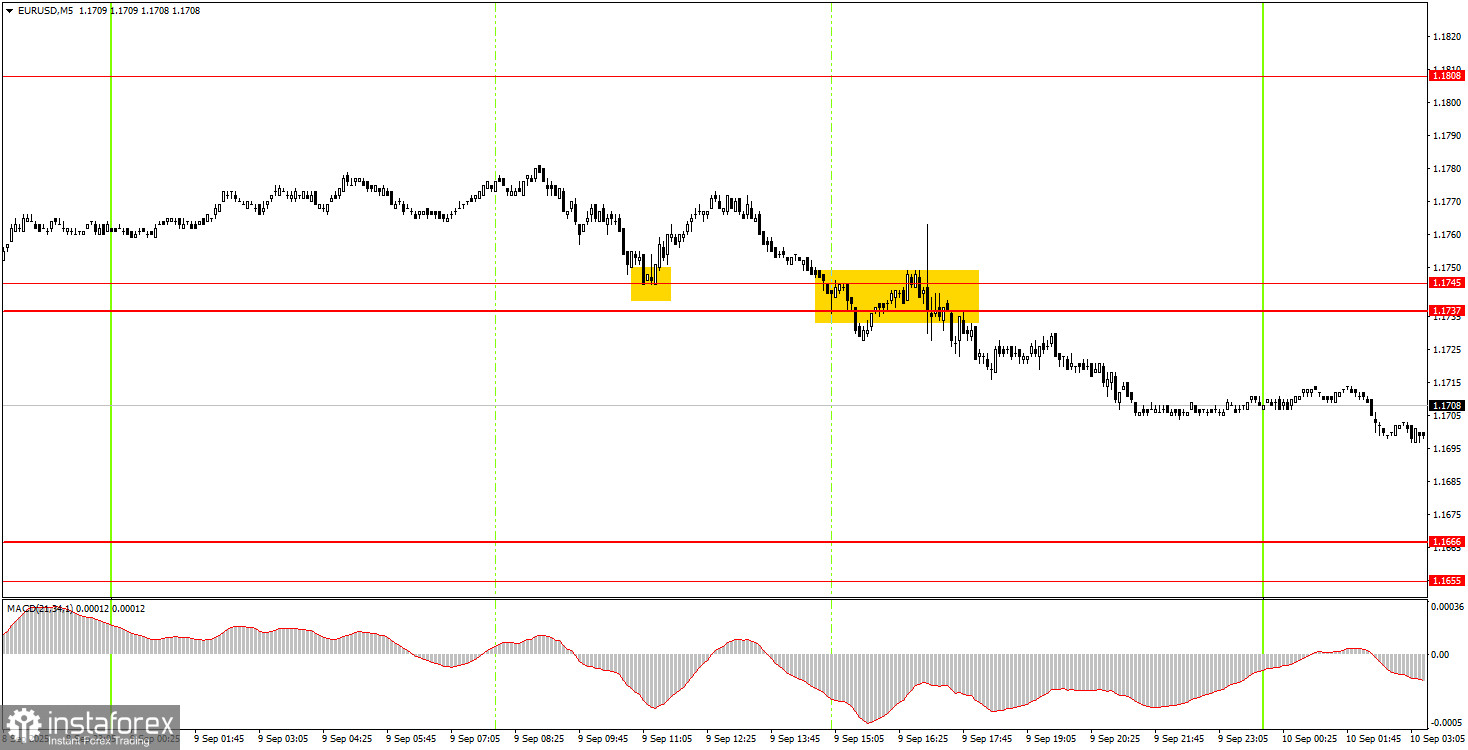
On the 5-minute chart on Tuesday, two trading signals were formed. First, the pair bounced from the 1.1737–1.1745 area but managed to rise only about 15 pips, which was enough to set a Stop Loss at breakeven. During the US trading session, a sell signal was formed; however, in this case, it would not have been worth the risk of opening short positions, given the weakness of the NonFarm Payrolls report.
On the hourly timeframe, the EUR/USD pair has every chance to resume the uptrend that has been forming since the beginning of the year—the flat can be considered over. The fundamental and macroeconomic backdrop remains disastrous for the US dollar, so we still expect no strengthening of the American currency. In our view, as before, the US dollar can only count on technical corrections.
On Wednesday, the EUR/USD pair may resume its upward movement, since the previous day's decline was absolutely illogical. However, new trading signals are needed in the 1.1655–1.1666 and 1.1737–1.1745 areas.
On the 5-minute chart, you should watch the levels: 1.1198–1.1218, 1.1267–1.1292, 1.1354–1.1363, 1.1413, 1.1455–1.1474, 1.1527, 1.1571–1.1584, 1.1655–1.1666, 1.1737–1.1745, 1.1808, 1.1851, 1.1908. On Wednesday, the US will release the Producer Price Index, which, in our view, is not very important. Last month, the PPI showed a strong number and triggered a decent market reaction. If today's figure is much different from the forecast, the reaction could also be significant.
Support and Resistance Levels: These are target levels for opening or closing positions and can also serve as points for placing Take Profit orders.
Red Lines: Channels or trendlines indicating the current trend and the preferred direction for trading.
MACD Indicator (14,22,3): A histogram and signal line used as a supplementary source of trading signals.
Important Events and Reports: Found in the economic calendar, these can heavily influence price movements. Exercise caution or exit the market during their release to avoid sharp reversals.
Forex trading beginners should remember that not every trade will be profitable. Developing a clear strategy and practicing proper money management are essential for long-term trading success.
InstaForex analytical reviews will make you fully aware of market trends! Being an InstaForex client, you are provided with a large number of free services for efficient trading.


