 Stay
Stay 
Trading Conditions
Products
Tools

On the weekly chart, the price has reached the upper boundary of the descending price channel. From here, there are two options: either a breakout upward from the current levels with the possibility of medium-term growth, or a reversal downward from the current levels for a medium-term decline.
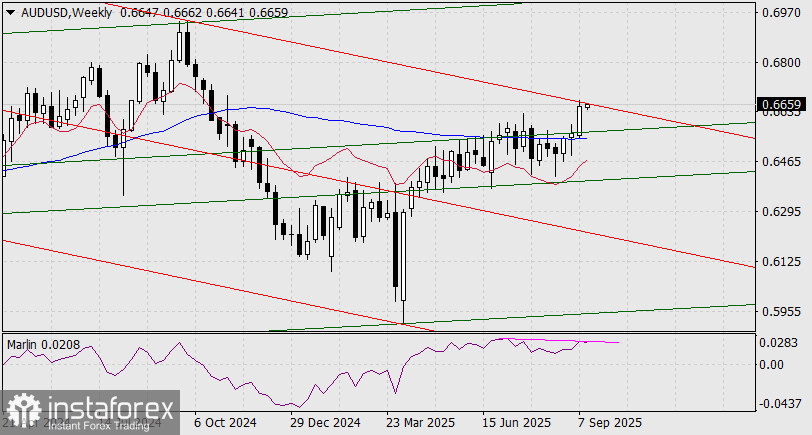
A divergence between the price and the Marlin oscillator suggests a higher probability of the downside scenario.
On the daily chart, consolidation below the July peak (0.6627) will be the first signal of a reversal.
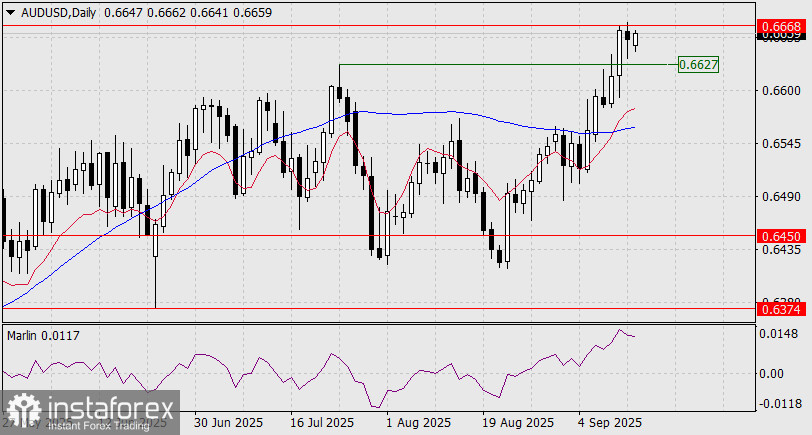
The Marlin oscillator is already indicating further downside. A break above 0.6668 opens the way to growth (alternative scenario).
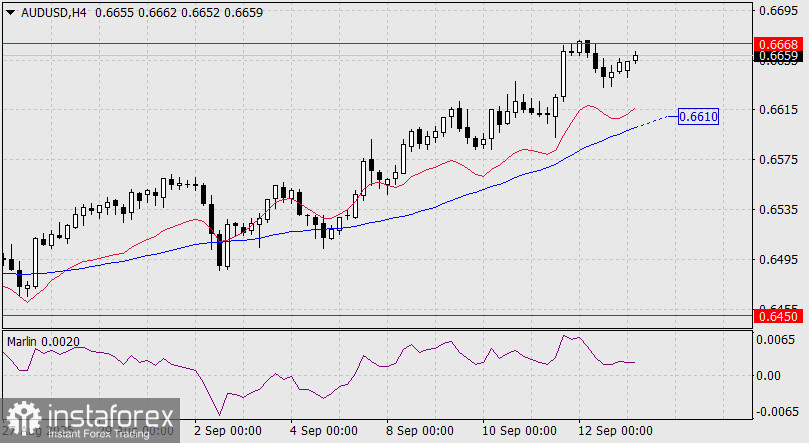
Consolidation below the MACD line on the four-hour chart (0.6610) will be a confirming signal of a price reversal.
The main driver for growth or decline will be the Fed's decision on monetary policy on September 17. We are waiting.
InstaForex analytical reviews will make you fully aware of market trends! Being an InstaForex client, you are provided with a large number of free services for efficient trading.


