 Stay
Stay 
Trading Conditions
Products
Tools


The EUR/USD currency pair continued its "tormented journey" on Thursday. Volatility during most of the day did not exceed 30 pips. Essentially, we witnessed another day completely devoid of movement. Fairness dictates mentioning that the macroeconomic backdrop on Thursday was very weak, but it still did not account for a total movement of only 30 pips. After all, a report on retail sales in the Eurozone came in worse than expected, and in the U.S., jobless claims were also released. These reports used to provoke a market reaction of 20-30 pips, which we considered weak and unworthy of attention. Now the pair is moving only 30 pips in a day.
From a technical standpoint, the flat on the daily timeframe continues, so market movements remain extremely weak. Market makers continue to accumulate positions in anticipation of a new trend, a process that has been ongoing for more than 5 months. Unfortunately, nothing can be done in this market situation. Regrettably, the market is dominated by large players, so all that's left is to wait for them to initiate a trend. We still anticipate growth at least within the bounds of the channel. However, with such volatility, the euro will crawl 150 pips to the level of 1.1800 over the next month.
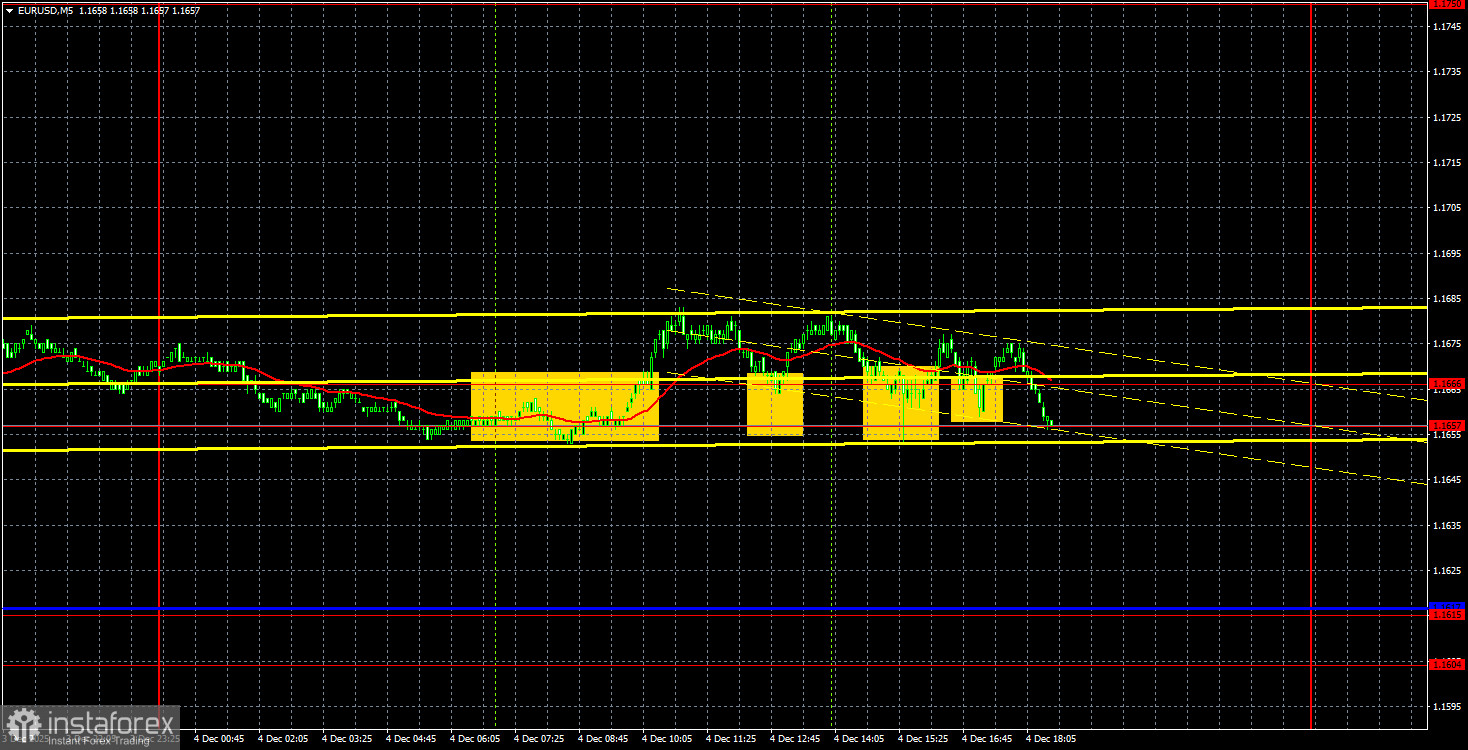
On the 5-minute timeframe, the pair bounced four times from the area of 1.1657-1.1666 yesterday, with the maximum upward movement after the signal was formed being only 10 pips. Once again, we remind you that if there are no movements in the market, then no signal will bring a profit.
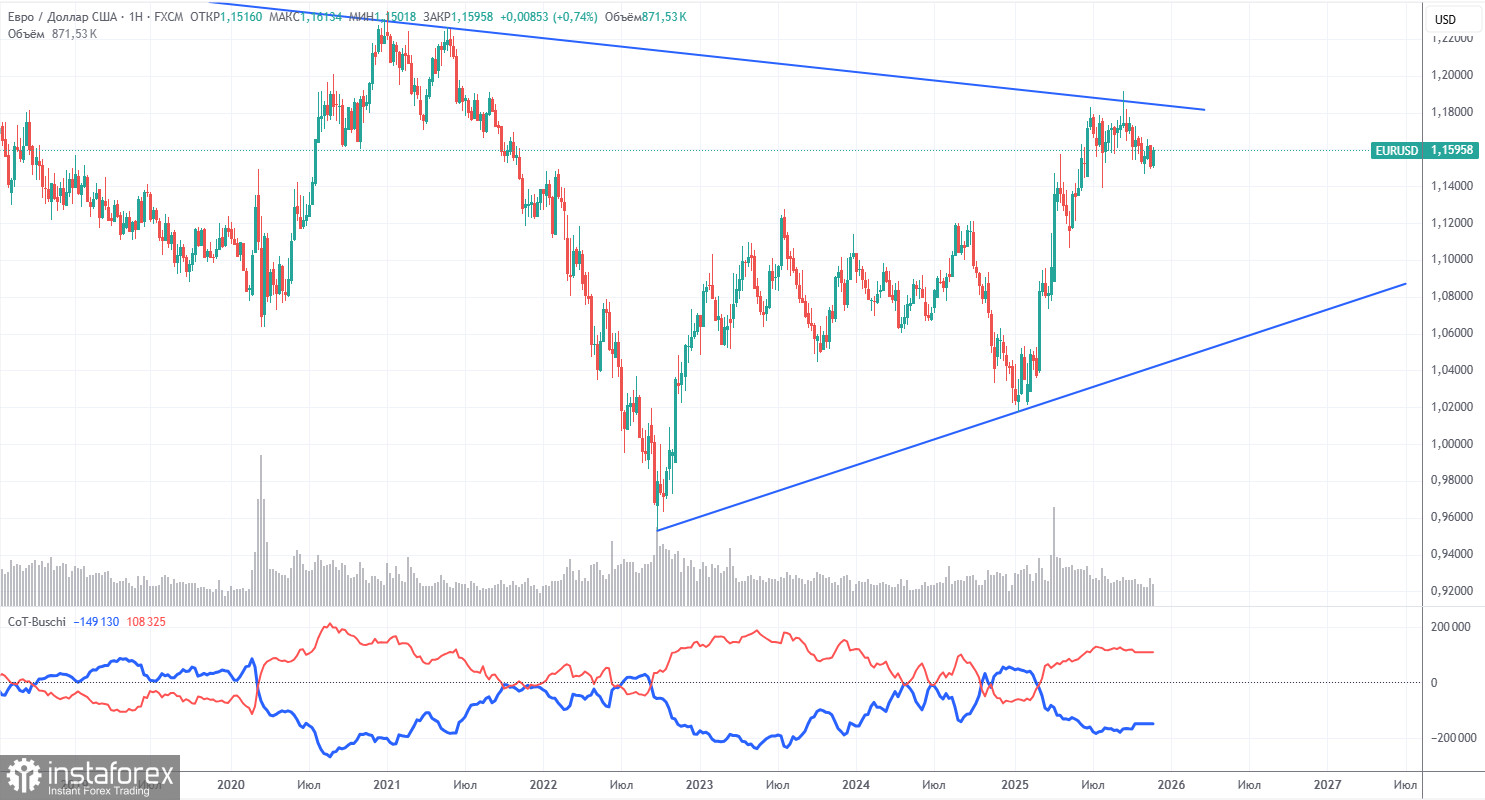
The latest COT report was released last week and is dated October 14, meaning it is somewhat outdated. The illustration clearly shows that the net position of non-commercial traders had long been "bullish," with bears struggling to gain a foothold in the zone of superiority towards the end of 2024, only to lose it quickly. Since Trump took office for a second time as U.S. president, only the dollar has been in decline.
We cannot state with 100% certainty that the decline of the American currency will continue, but current global developments suggest this scenario. We still do not see any fundamental factors that would strengthen the European currency, while there are plenty of factors that could lead to a decline in the dollar. The global downward trend remains intact, but it is less relevant to consider where the price has moved over the last 17 years at this point. The dollar may grow if the global fundamental picture changes, but there are currently no signs of that.
The positioning of the red and blue lines in the indicator continues to suggest that the "bullish" trend is preserved. Over the last reporting week, the number of long positions within the "Non-commercial" group decreased by 12,900, while the number of short positions increased by 2,800. Consequently, the net position decreased by 10,100 contracts over the week. However, this data is already outdated and holds little significance.
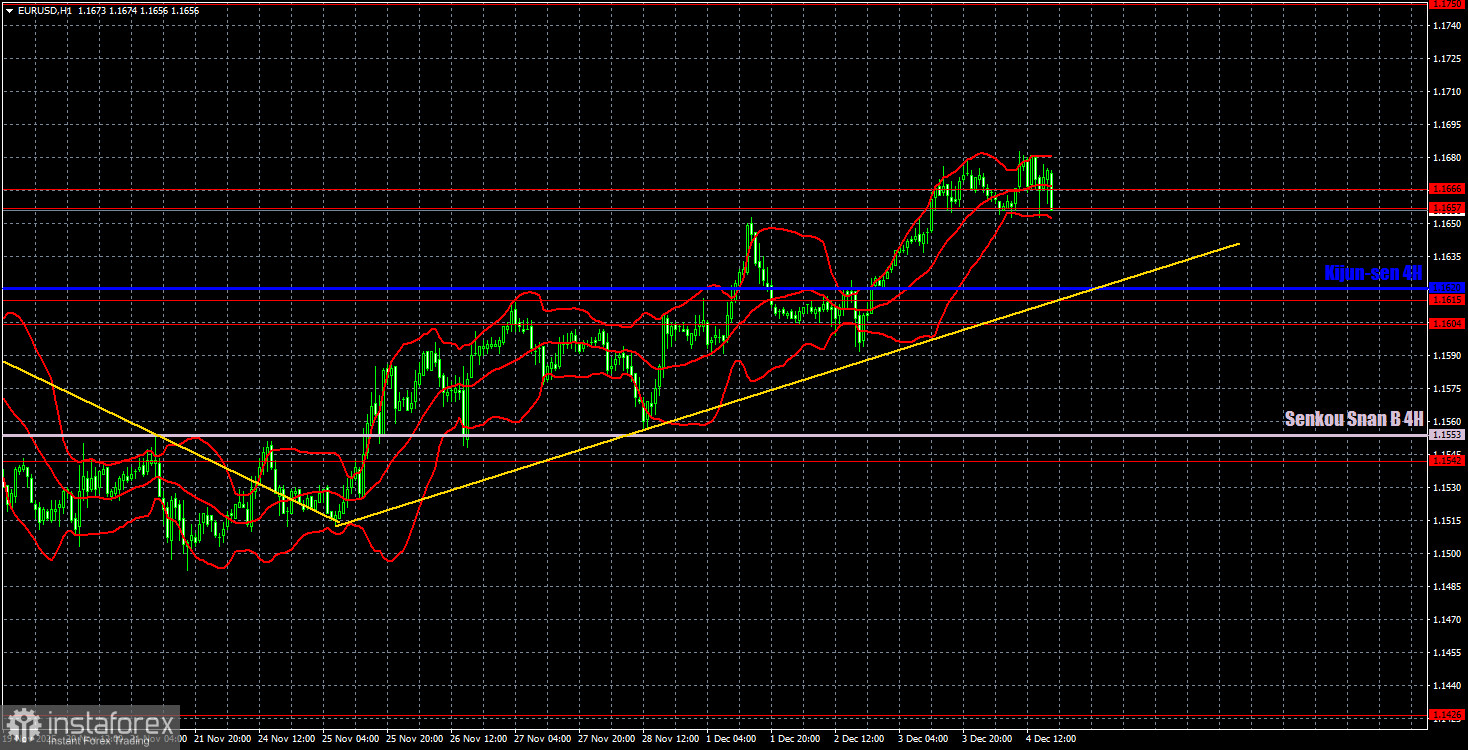
On the hourly timeframe, the EUR/USD pair continues to form an upward trend, but it is moving up very slowly, as if reluctantly. The price remains within the daily timeframe's sideways channel of 1.1400-1.1830, so an increase in the euro towards 1.1800 can still be expected in the near term. The rise of the euro is extremely weak, but movements within the flat are always weak and chaotic.
For December 5, we highlight the following levels for trading: 1.1234, 1.1274, 1.1362, 1.1426, 1.1542, 1.1604-1.1615, 1.1657-1.1666, 1.1750-1.1760, 1.1846-1.1857, 1.1922, 1.1971-1.1988, as well as the Senkou Span B line (1.1553) and the Kijun-sen line (1.1620). The Ichimoku indicator lines may shift throughout the day, which should be taken into account when determining trading signals. Don't forget to set the Stop Loss order to breakeven if the price moves in the right direction by 15 pips. This will protect against potential losses if the signal turns out to be false.
On Friday, the Eurozone is scheduled to publish its second estimate of third-quarter GDP. We remind you that the market has already calmly ignored the recent EU inflation and unemployment reports, despite both featuring notable figures. In the U.S., reports on the PCE (Personal Consumption Expenditures) price index, consumer sentiment from the University of Michigan, and personal income and spending of American consumers are also scheduled for release. These are not the most important reports either.
On Friday, traders may once again trade from the area of 1.1657-1.1666. If a rebound occurs from this area, new long positions can be considered with a target of 1.1750. A consolidation below this area would lead to short positions with a target in the 1.1604-1.1615 area.
InstaForex analytical reviews will make you fully aware of market trends! Being an InstaForex client, you are provided with a large number of free services for efficient trading.


