 Stay
Stay 
Trading Conditions
Products
Tools


The EUR/USD currency pair moved only in one direction – upwards – during Wednesday and Thursday. The volatility was quite high this time, unlike what we have been accustomed to in recent months. In principle, it is clear to all traders where this movement is coming from. On Wednesday evening, the Federal Reserve held a meeting, announcing its decision to lower the key interest rate (which was quite expected) and outlining "neutral" prospects for monetary policy for the upcoming year. We do not consider the Fed's meeting results to be definitively "dovish," as the decision to reduce the key interest rate in December was known a few weeks earlier. However, we have consistently stated that whatever decision the Fed makes, we expect only a decline in the dollar. At a minimum, within the range of the sideways channel aimed at 1.1800. At the most, we anticipate a resumption of the upward trend of 2025. For now, everything is heading in that direction, as the global fundamental background remains disastrous for the dollar, and a flat trend will eventually come to an end.
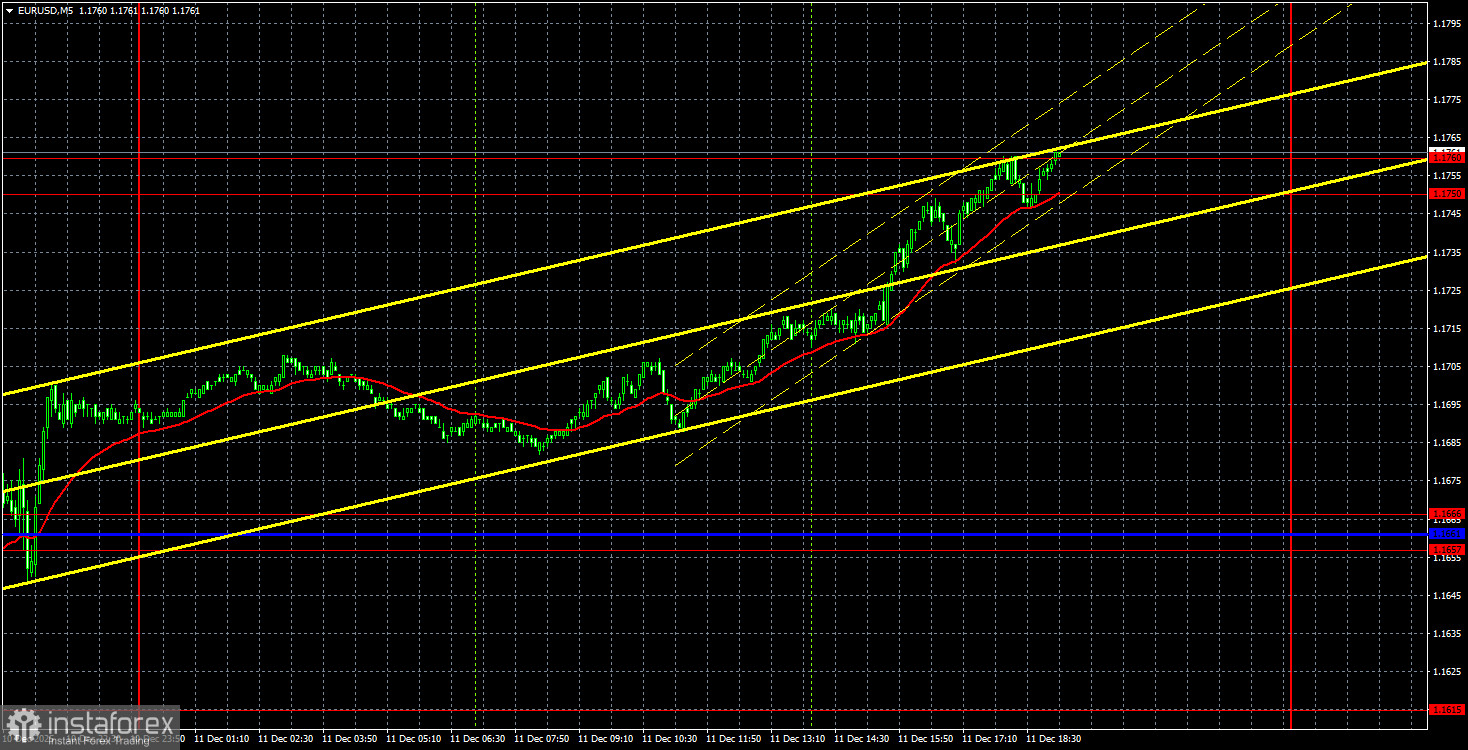
On the 5-minute timeframe, no trading signals were formed yesterday, as all trading signals were established on Wednesday evening. It was at that point that the pair overcame the area of 1.1657-1.1666, after which on Thursday, it worked through and also surpassed the region of 1.1750-1.1760. The upper boundary of the sideways channel on the daily timeframe is just within reach.
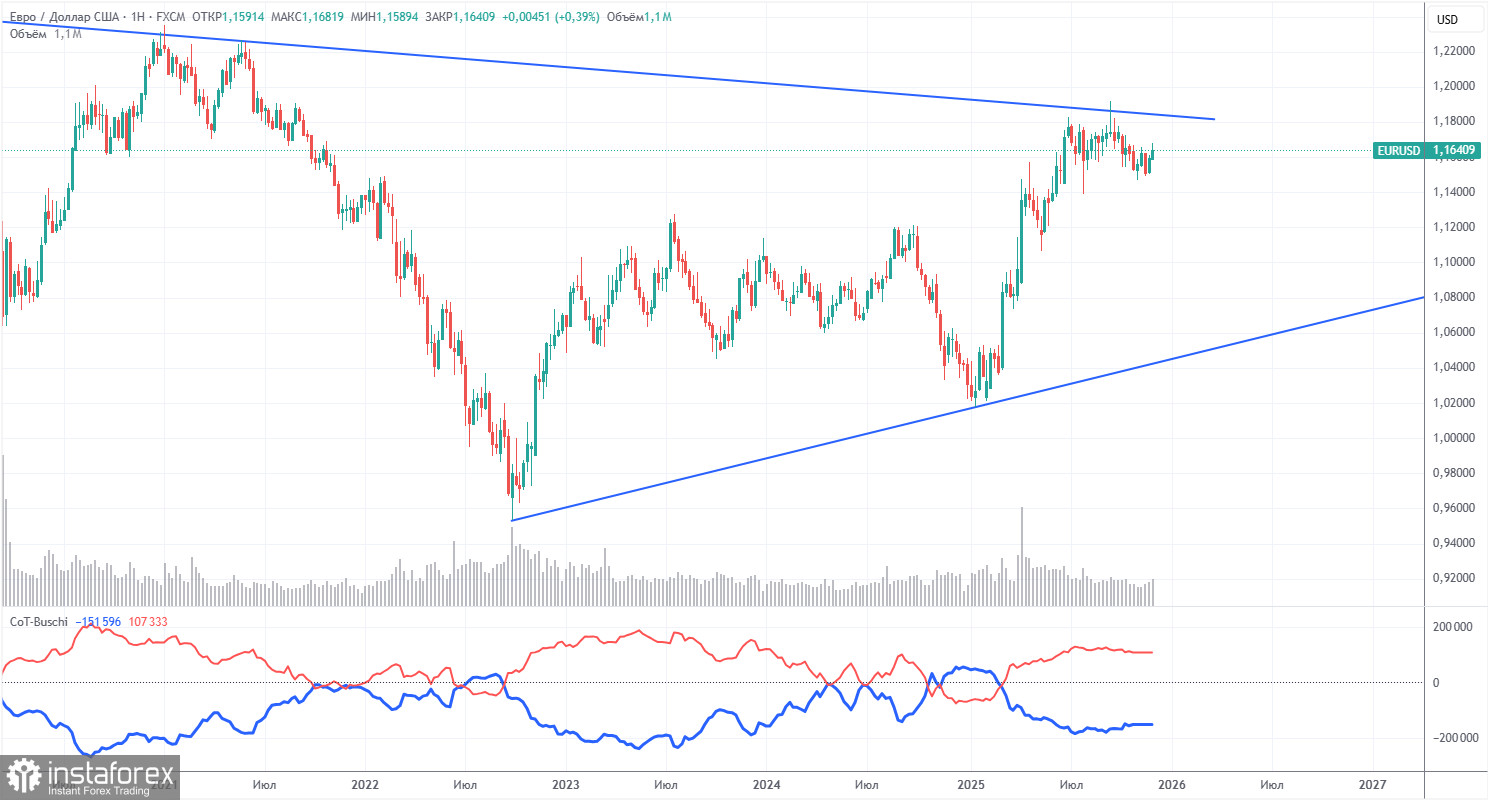
The latest COT report was released last week and is dated October 28. This means it is, to put it mildly, outdated. The illustration above clearly shows that the net position of non-commercial traders has been "bullish" for a long time, with bears struggling to enter their own zone of superiority at the end of 2024 but quickly losing it. Since Trump took office as president of the United States for the second time, only the dollar has been declining. We cannot say with 100% certainty that the decline of the American currency will continue, but current global developments hint at that possibility.
We still do not see any fundamental factors that would strengthen the European currency, while there remain sufficient factors for the decline of the American one. The global downward trend is still in place, but what does it matter where the price has moved in the last 17 years? The dollar could rise if the global fundamental picture changes, but so far, there are no signs of this.
The position of the red and blue lines of the indicator continues to indicate a sustained "bullish" trend. During the last reporting week, the number of long positions in the "Non-commercial" group increased by 5,900, while the number of shorts rose by 10,300. Consequently, the net position decreased by 4,400 contracts over the week. However, this data is already outdated and holds no significance.
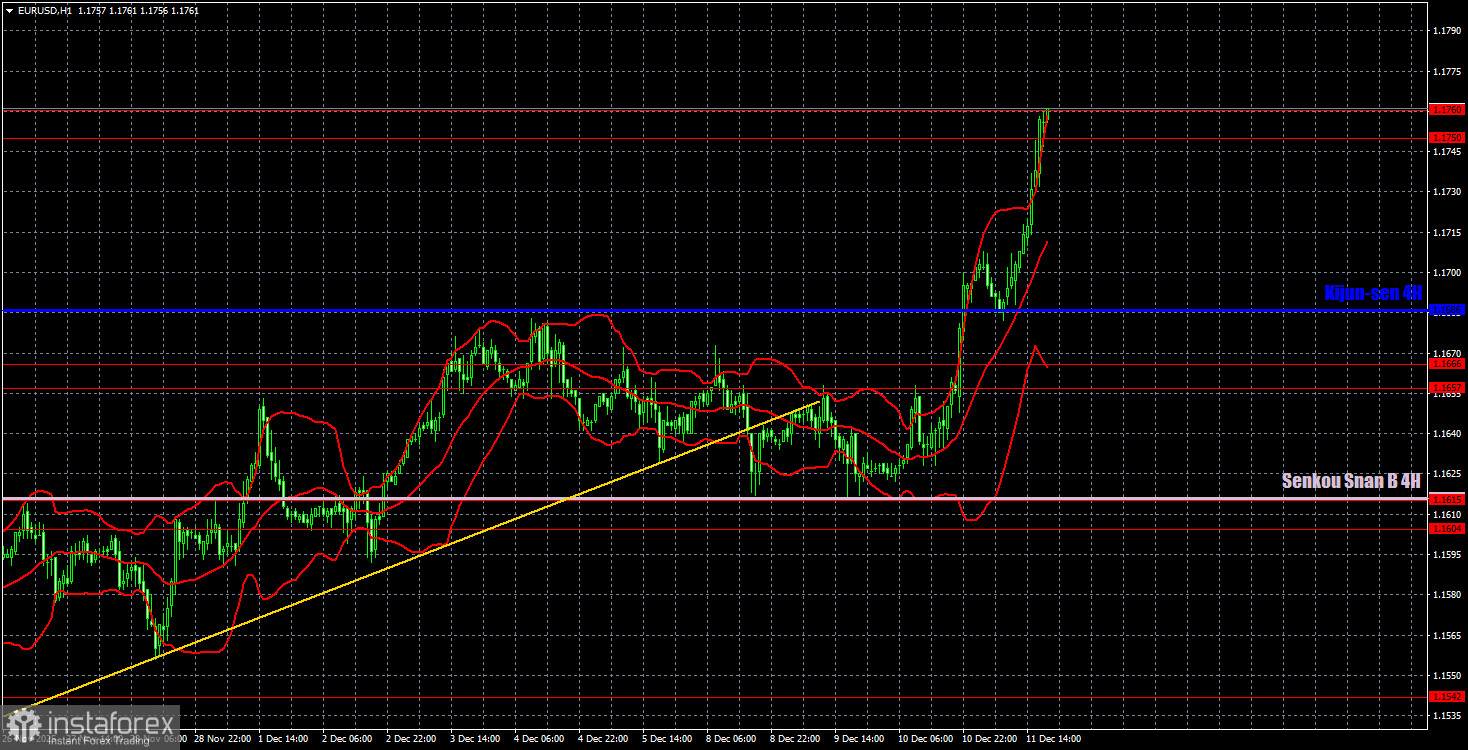
On the hourly timeframe, the EUR/USD pair continues its upward movement, fully aligning with our expectations. As we warned, one should not rush to conclusions about the end of the upward trend until a consolidation below the Senkou Span B line occurs. The price remains within the sideways channel of 1.1400-1.1830 on the daily timeframe, so one can still expect the euro to strengthen to 1.1800 in the near future. We also anticipate that the upward trend of 2025 will resume in December.
For December 12, we highlight the following levels for trading: 1.1234, 1.1274, 1.1362, 1.1426, 1.1542, 1.1604-1.1615, 1.1657-1.1666, 1.1750-1.1760, 1.1846-1.1857, 1.1922, 1.1971-1.1988, as well as the Senkou Span B line (1.1616) and Kijun-sen (1.1686). The lines of the Ichimoku indicator may shift throughout the day, which should be taken into account when determining trading signals. Do not forget to set a Stop Loss order to break even if the price moves in the correct direction by 15 pips. This will protect against potential losses in case the signal turns out to be false.
On Friday, the second estimate of German inflation is scheduled for release in the Eurozone, and this report is clearly secondary. In the near term, the EUR/USD pair will face a serious technical dilemma: either conclude the flat on the daily timeframe or remain within the sideways channel of 1.1400-1.1830.
On Friday, traders can trade from the area of 1.1750-1.1760. A bounce from this area will allow traders to open short positions, with a target at the Kijun-sen line at 1.1686. Overcoming the specified area will allow holding long positions or opening new ones, with a target of 1.1800-1.1830.
InstaForex analytical reviews will make you fully aware of market trends! Being an InstaForex client, you are provided with a large number of free services for efficient trading.


