 Stay
Stay 
Trading Conditions
Products
Tools


The EUR/USD currency pair did not trade as expected on Thursday. There were at least three significant events scheduled for the day, each with the potential to impact either the euro or the dollar. In fact, all three had an impact, but the movements observed throughout the day more closely resembled a flat market than anything else. Essentially, only the U.S. inflation report warranted attention. The Consumer Price Index in the U.S. unexpectedly slowed to 2.7%, making it easy to suggest that the Federal Reserve may lower the key interest rate more than once in 2026. Thus, the dollar had every chance to decline significantly. However, it did not.
At the same time, the Bank of England predictably lowered the key interest rate by 0.25%, taking an expected but "borderline" decision. The European Central Bank made no decisions, so there was essentially no reaction to these two events. As anticipated, we saw volatility rise and emotions surge, but there were no interesting movements.
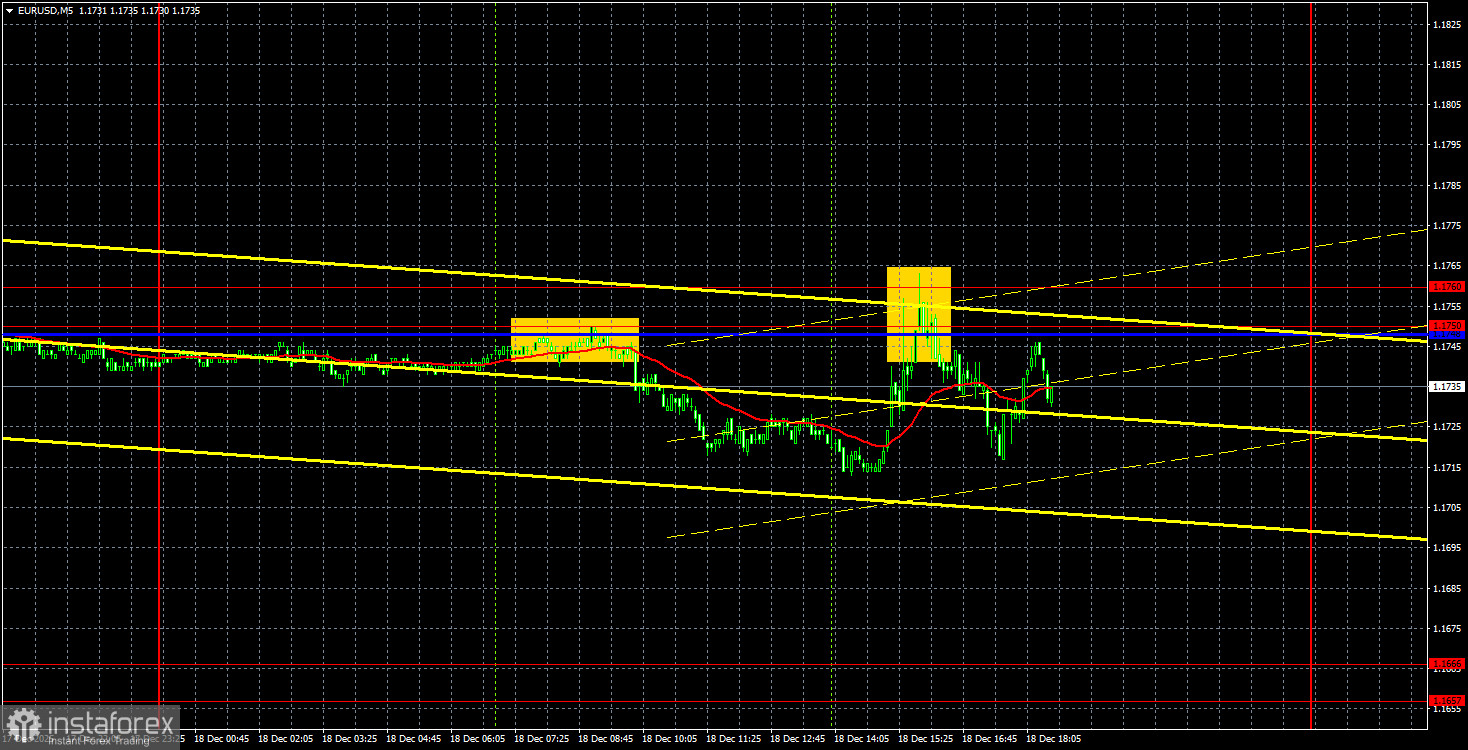
On the 5-minute time frame yesterday, two trading signals were formed. The price bounced twice from the area of 1.1748-1.1760 from below, provoking a relatively small decline. The price did not even come close to the nearest target area. This was clearly not the kind of movement traders were hoping for yesterday while checking the events calendar.
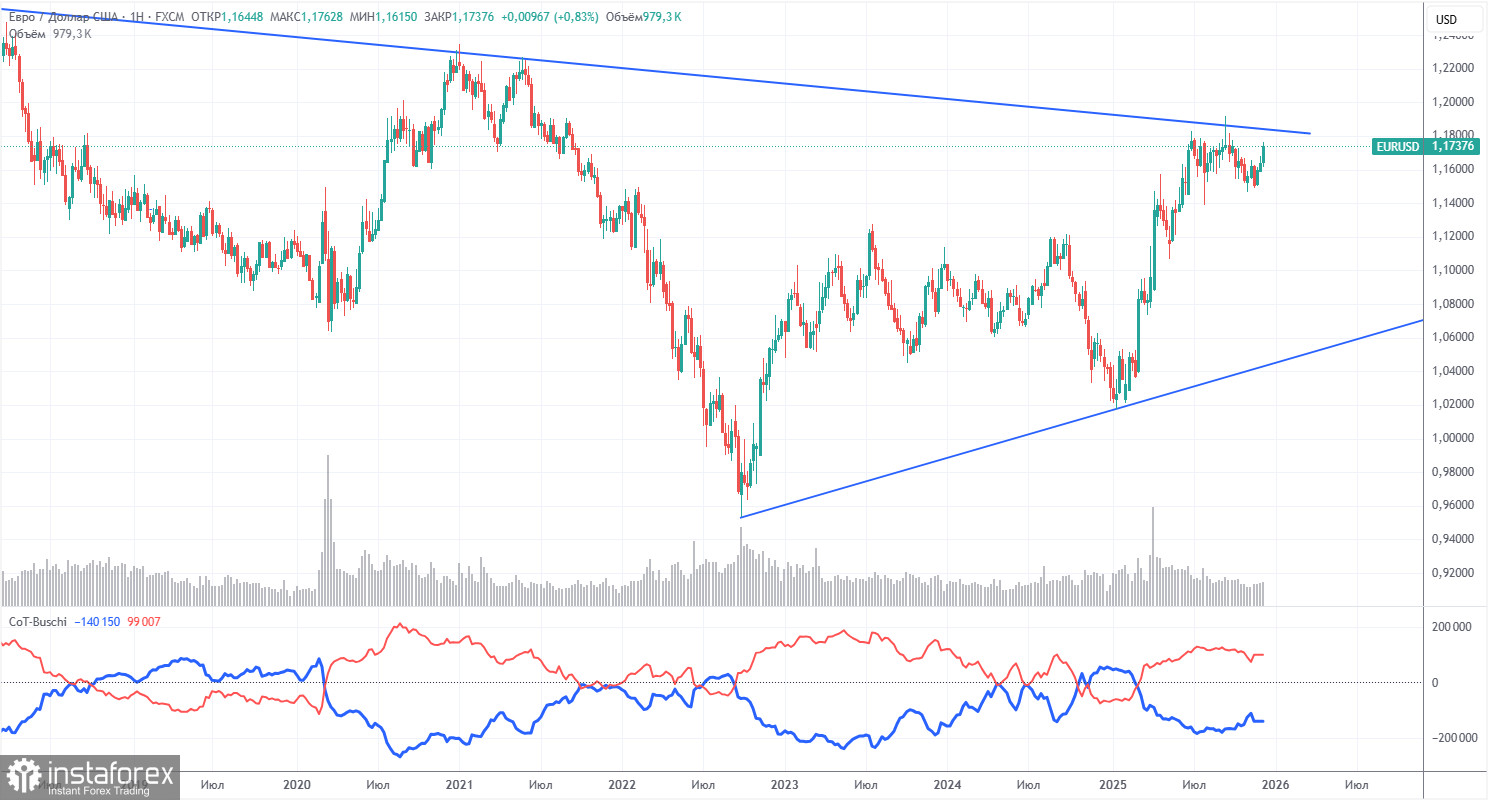
The latest COT report was released last week and is dated November 18, so it is still outdated. The illustration above clearly shows that the net position of non-commercial traders has been "bullish" for a long time, with bears barely entering a zone of their own superiority at the end of 2024, only to quickly lose it. Since Trump took office as President of the United States for a second time, the dollar has been in decline. We cannot say with 100% certainty that the decline of the American currency will continue, but the current developments in the world suggest this outcome.
We still do not see any fundamental factors supporting the strengthening of the euro, while there are still enough factors supporting the decline of the American dollar. The global downward trend is still intact, but what matters now is where the price has moved over the past 17 years. The dollar may strengthen if the global fundamental picture changes, but there are currently no signs of that.
The position of the red and blue lines of the indicator continues to indicate the persistence of a bullish trend. Over the last reporting week, the number of longs in the "Non-commercial" group increased by 8,000, while the number of shorts decreased by 17,400. Consequently, the net position increased by 25,400 contracts over the week. However, this data remains outdated and holds no significance.
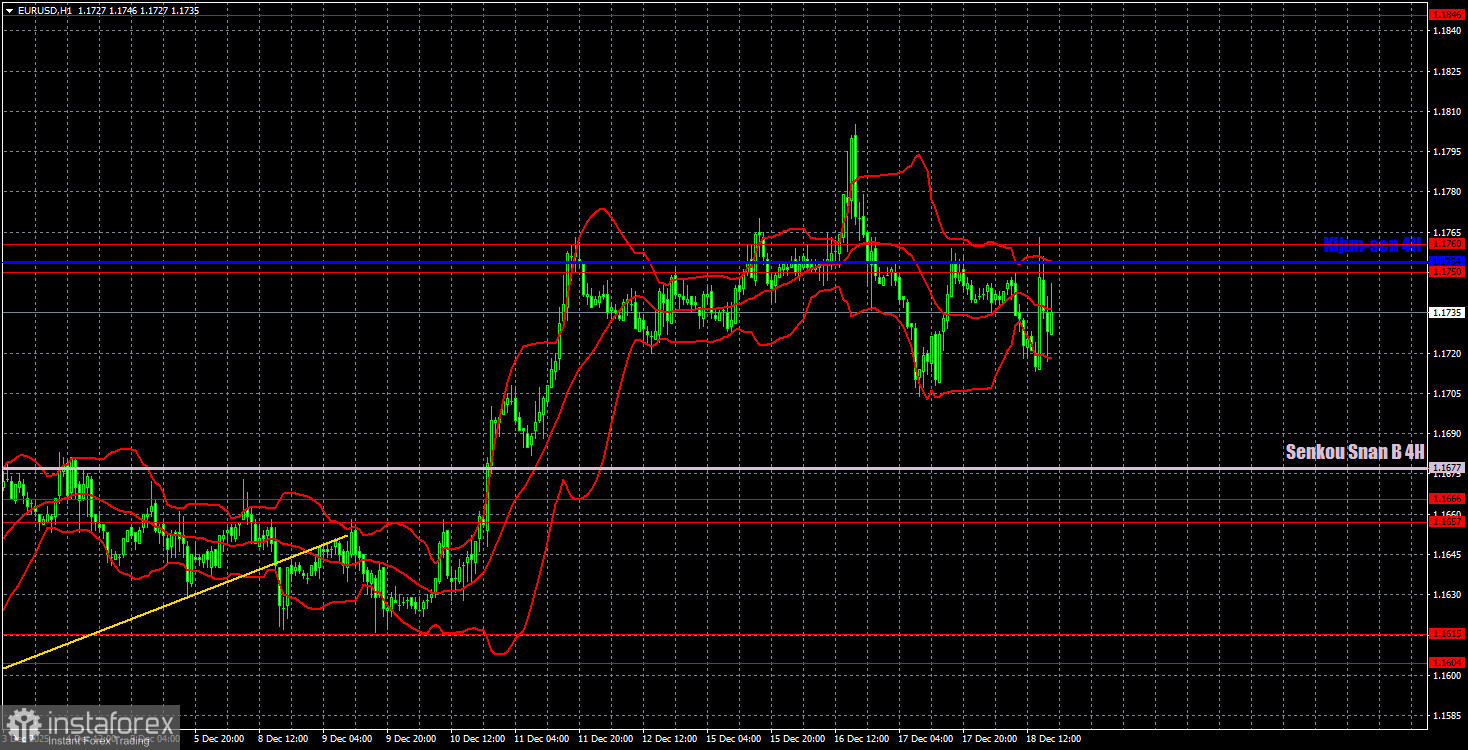
On the hourly time frame, the EUR/USD pair maintains an upward trend within a complex macroeconomic week. In fact, the upper line of the sideways channel at 1.1400-1.1830 has been tested, so we may now observe a technical decline, as the flat pattern persists on the daily time frame. Essentially, we saw a reversal near the channel's upper boundary, suggesting a possible decline towards its lower boundary. However, we still believe that the upward movement will continue.
For December 19, we highlight the following levels for trading: 1.1234, 1.1274, 1.1362, 1.1426, 1.1542, 1.1604-1.1615, 1.1657-1.1666, 1.1750-1.1760, 1.1846-1.1857, 1.1922, 1.1971-1.1988, as well as the Senkou Span B line (1.1677) and the Kijun-sen line (1.1754). The lines of the Ichimoku indicator may shift throughout the day, which should be taken into account when determining trading signals. Do not forget to set a Stop Loss order at breakeven if the price moves in the correct direction by 15 pips. This will safeguard against potential losses if the signal turns out to be false.
On Friday, there are no interesting events scheduled in the Eurozone, while in the U.S., the only notable event is the University of Michigan consumer sentiment index, which is not a primary significance report. Volatility on the last trading day of the week may be even lower.
On Friday, traders may trade in the 1.1750-1.1760 range. A bounce in price from this area will again make short positions relevant, with a target at the Senkou Span B line. A consolidation above this area will lead to another attempt to break out of the sideways channel at 1.1400-1.1830 through the upper boundary. In this case, long positions will become relevant.
Support and resistance price levels are indicated by thick red lines around which the movement may conclude. They are not sources of trading signals.
Kijun-sen and Senkou Span B lines are lines of the Ichimoku indicator, transferred to the hourly time frame from the 4-hour time frame. They are strong lines.
Extreme levels are thin red lines from which the price has previously bounced. They are sources of trading signals.
Yellow lines represent trend lines, trend channels, and any other technical patterns.
Indicator 1 on COT charts shows the size of each category of traders' net position.
InstaForex analytical reviews will make you fully aware of market trends! Being an InstaForex client, you are provided with a large number of free services for efficient trading.


