 Stay
Stay 
Trading Conditions
Products
Tools


On the hourly chart, the GBP/USD pair on Friday continued its sideways movement between the Fibonacci level of 100.0% at 1.3470 and the resistance level of 1.3533–1.3539. A rebound from either of these levels will generate a trading signal in the opposite direction. A consolidation of prices below 1.3470 will increase the likelihood of a continued decline. A close above the 1.3533–1.3539 level will allow the bulls to launch a new attack.
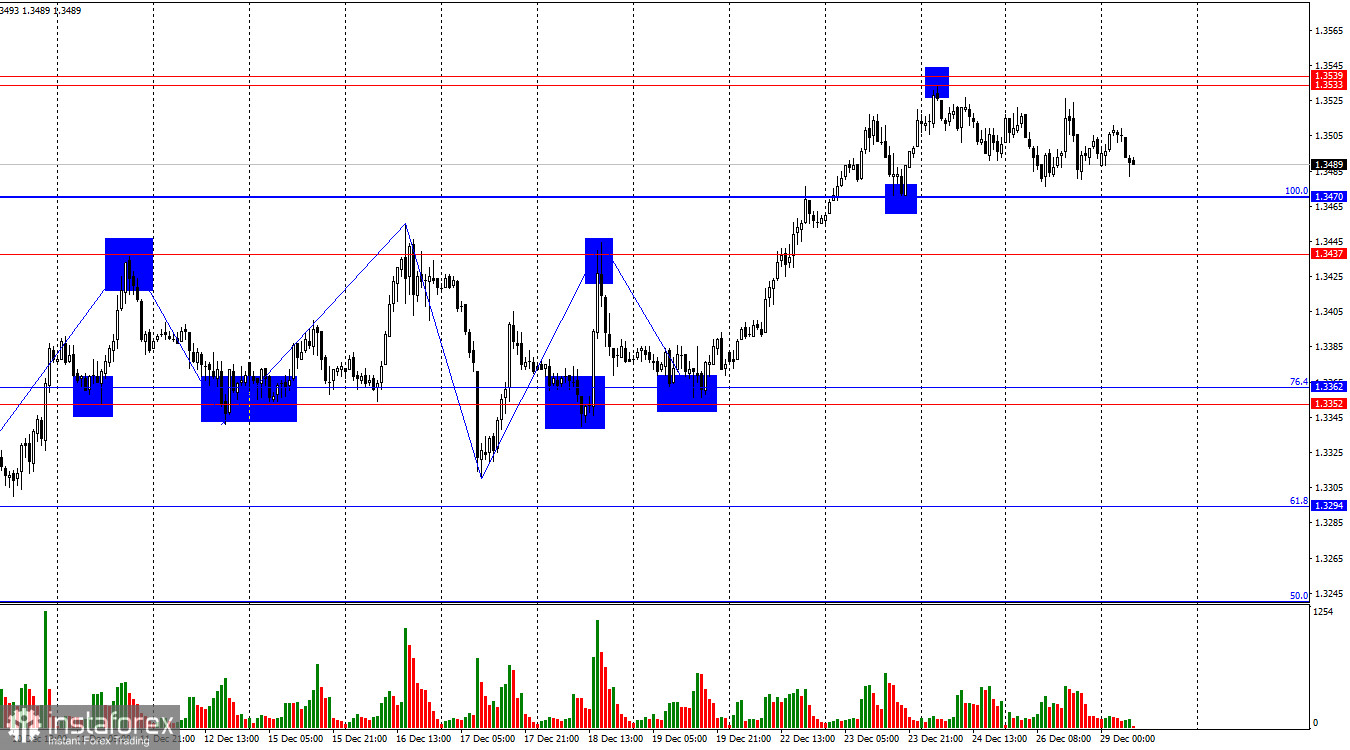
The wave structure has once again transformed into a "bullish" one after the completion of the sideways phase. The most recently completed downward wave failed to break the previous low, while the new upward wave managed to exceed the previous peak. The news background for the British pound has been weak in recent weeks, but the information backdrop in the United States also leaves much to be desired. Bulls and bears were engaged in a tug-of-war throughout the week and remained in relative balance, but in the week leading up to the New Year, the bulls moved on the offensive.
There was no news background on Friday, but December news from the United States allowed bullish traders to move into a new offensive. In honor of the holidays, their enthusiasm and activity have faded somewhat, but after the New Year the offensive may resume. At this time, it is already appropriate to talk about the coming year, since during the current week there will be more holidays than working days. Of course, the market will be open on December 31, but who will be opening trades on New Year's Day? Thus, I believe that the sideways movement will persist until the end of the year, but if trading signals appear, traders may well act on them. The news background will be absent not only today but throughout the entire current week. Only technical (chart) analysis can help traders make trading decisions.
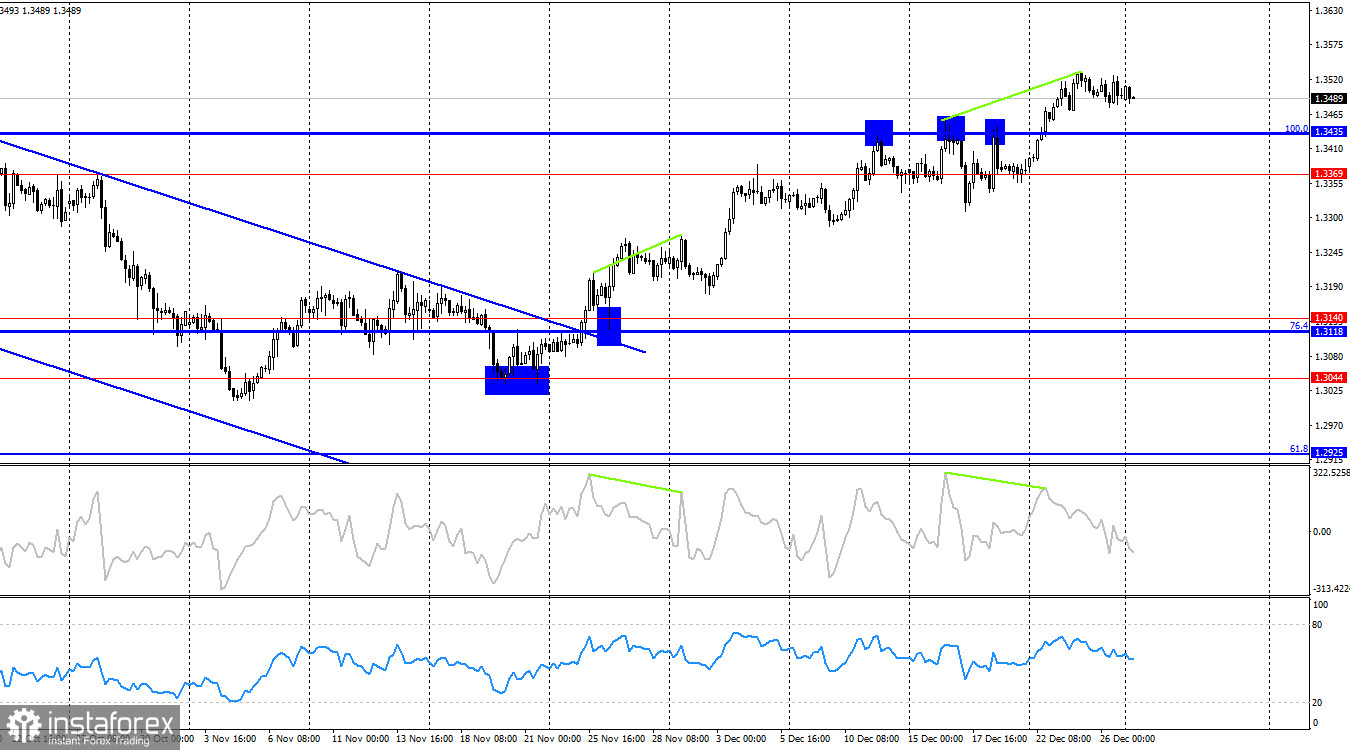
On the 4-hour chart, the pair has consolidated above the 100.0% corrective level at 1.3435, which allows for expectations of continued growth toward the next Fibonacci level of 127.2% at 1.3795. A "bearish" divergence has formed on the CCI indicator, which may trigger a reversal in favor of the U.S. dollar and a return to the support level of 1.3369–1.3435. A rebound from the 1.3435 level would increase the chances of continued growth for the British pound.
Commitments of Traders (COT) Report:
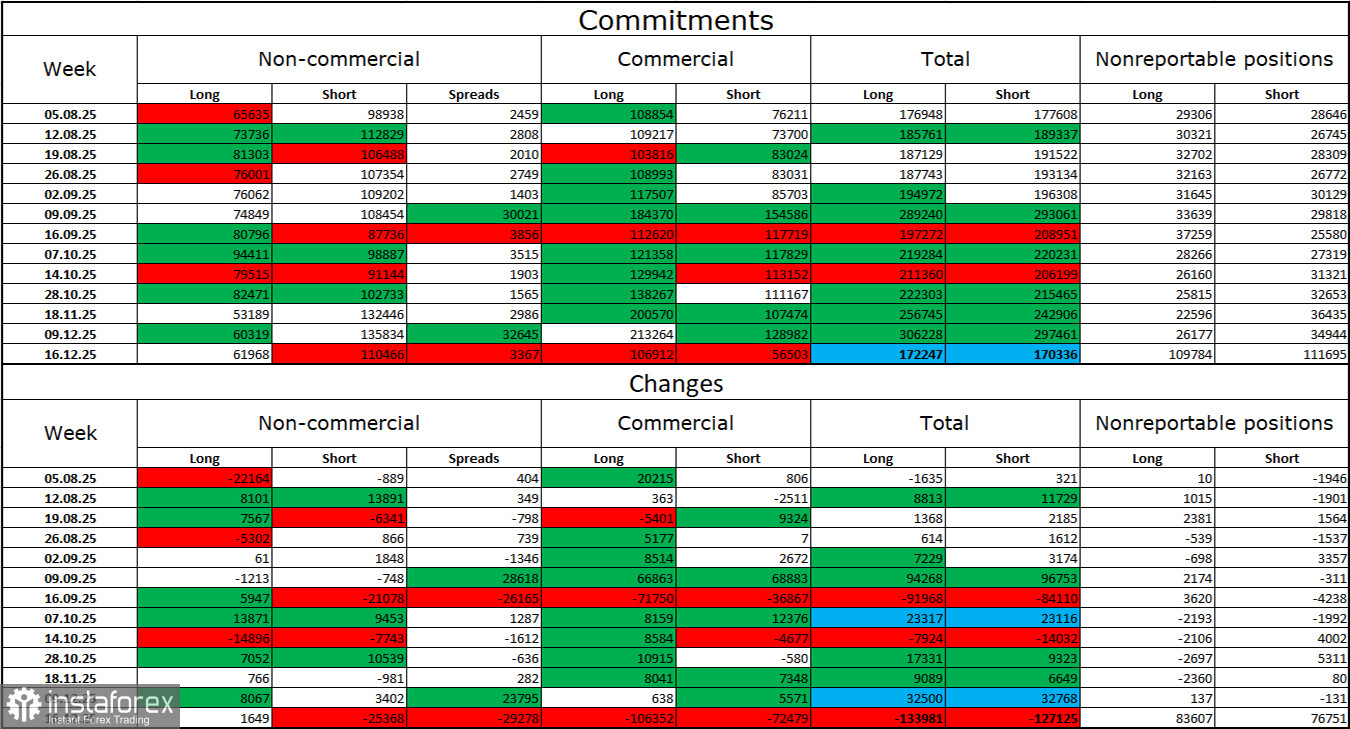
The sentiment of the "Non-commercial" trader category became more "bullish" over the latest reporting week. The number of long positions held by speculators increased by 1,649, while the number of short positions decreased by 25,368. The gap between the number of long and short positions currently stands at approximately 61 thousand versus 110 thousand. As we can see, bears dominate in December, but the British pound appears to have already exhausted its downside potential. At the same time, the situation with euro currency contracts is exactly the opposite. I still do not believe in a "bearish" trend for the pound.
In my view, the British pound still looks less "dangerous" than the dollar. In the short term, the U.S. currency may enjoy occasional demand in the market, but not in the long term. Donald Trump's policies have led to a sharp decline in the labor market, and the Federal Reserve has been forced to ease monetary policy to halt rising unemployment and stimulate job creation. For 2026, the FOMC does not plan strong monetary easing, but at present no one can be sure that the Fed's stance will not shift to a more "dovish" one during the year.
News Calendar for the U.S. and the U.K.:
On December 29, the economic calendar contains no scheduled events. The influence of the news background on market sentiment on Monday will be absent.
GBP/USD Forecast and Trading Advice:
Selling the pair was possible on a rebound from the 1.3533–1.3539 zone on the hourly chart, with a target of 1.3470. Short positions can be kept open. If the 1.3470 level is broken, short trades can be held with targets at 1.3437 and 1.3362. I can recommend buying on a rebound from the 1.3437–1.3470 level with a target of 1.3533–1.3539.
Fibonacci grids are drawn from 1.3470–1.3010 on the hourly chart and from 1.3431–1.2104 on the 4-hour chart.
InstaForex analytical reviews will make you fully aware of market trends! Being an InstaForex client, you are provided with a large number of free services for efficient trading.


