 Stay
Stay 
Trading Conditions
Products
Tools


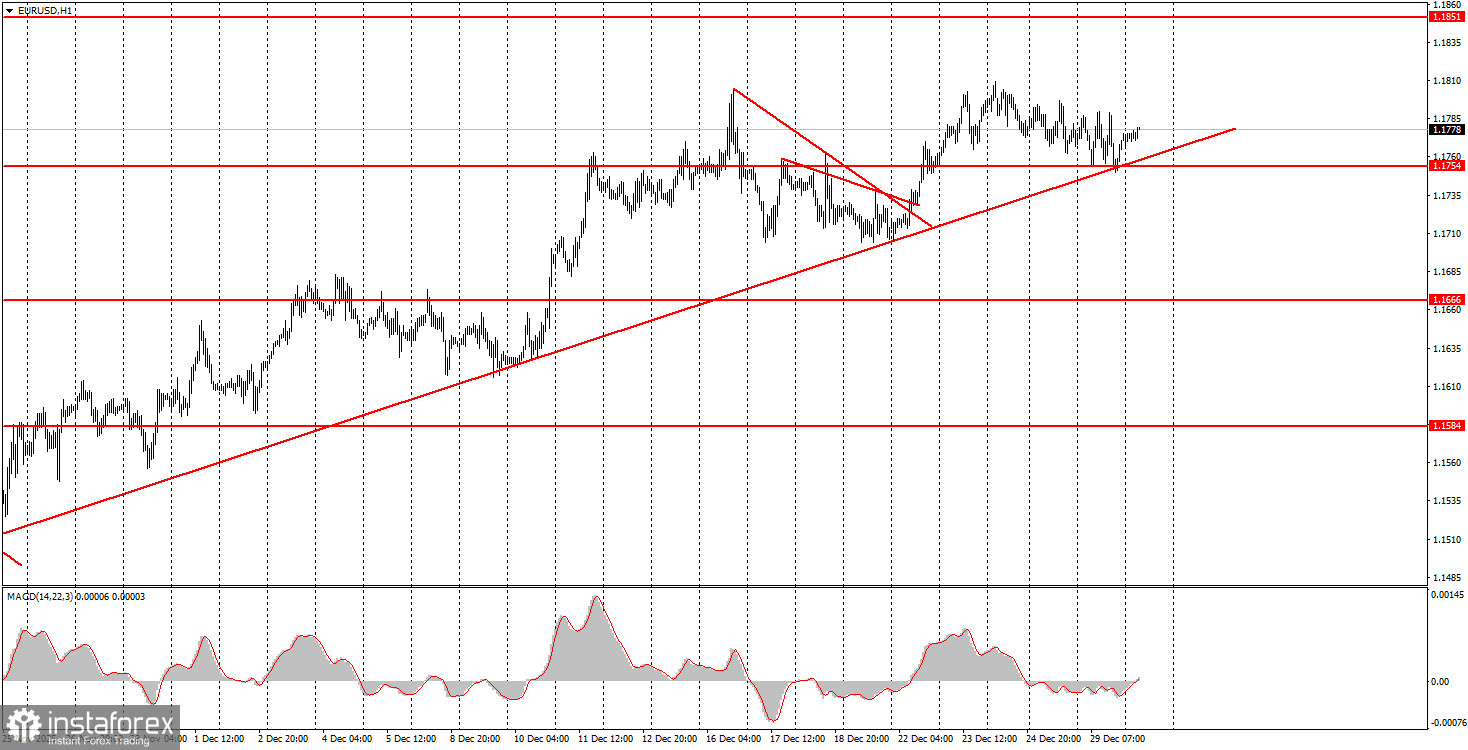
The EUR/USD currency pair again showed no notable movements on Monday but formed a very important technical signal. Throughout the day, the ascending trend line that has been supporting the growth of the European currency for about three weeks was engaged. The price bounced off the trend line, providing technical grounds for the resumption of the euro's growth. If the euro rises on December 30-31, it is likely the British pound will appreciate as well. In general, there is not much more to analyze from yesterday; the macroeconomic and fundamental backdrop was absent, the holidays continue, and volatility is minimal. The euro retains excellent growth prospects and is still very close to the 1.1800-1.1830 range, the upper boundary of the six-month lateral channel 1.1430-1.1800. Therefore, we are almost sure that this area will be surpassed soon, and the global upward trend of 2025 will resume.
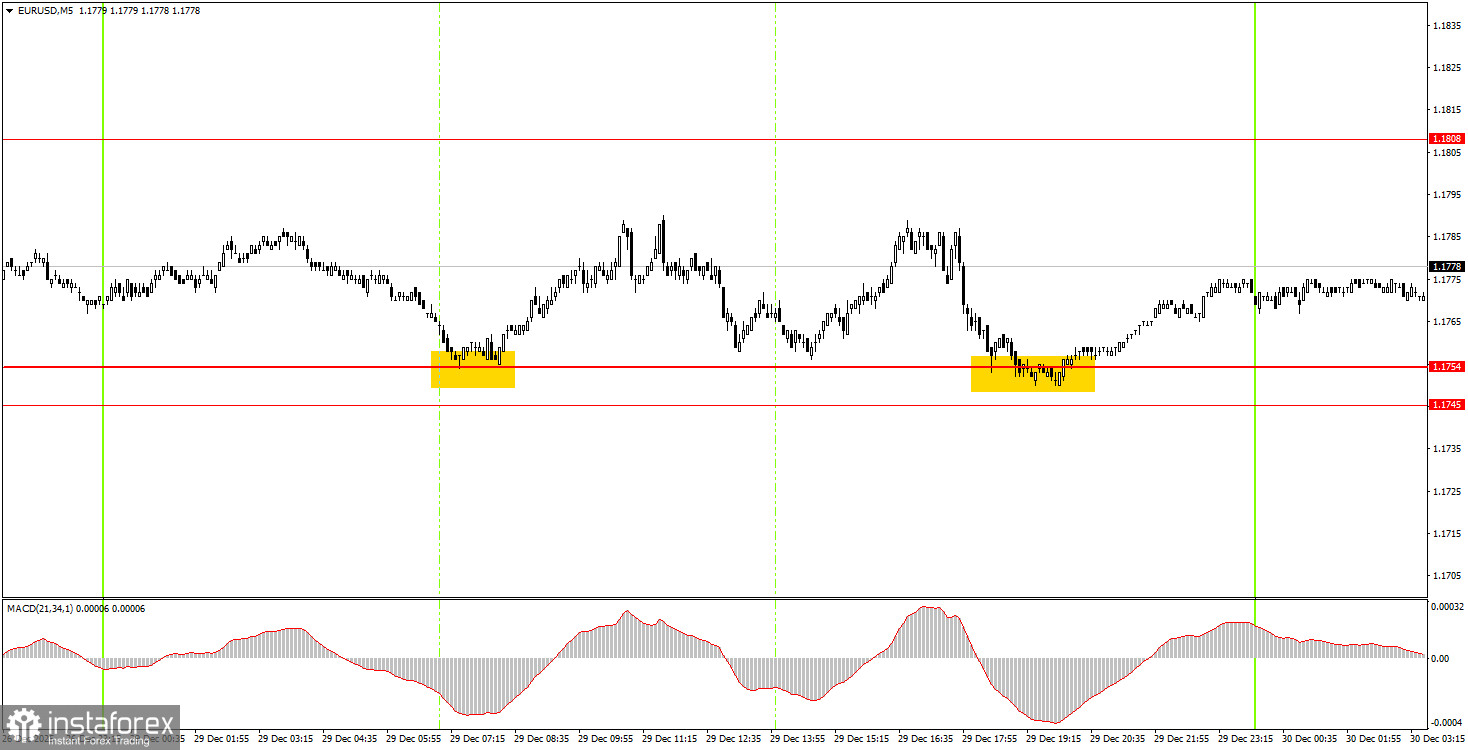
On the 5-minute timeframe, two buy signals were formed on Monday. The price bounced off the 1.1745-1.1754 area twice. In the first case, the price moved about 25 pips in the desired direction, while in the second case it moved even less, but the buy position could be left open in anticipation of continued growth on Tuesday. It is worth noting that an important bounce from the trend line was formed on the hourly timeframe, so the upward movement could continue.
On the hourly timeframe, the EUR/USD pair continues to form an upward trend. The price may soon retest the 1.1800-1.1830 area, which marks the upper boundary of the flat on the daily timeframe. It is quite possible that this time we will see a breakout from the six-month lateral channel. The overall fundamental and macroeconomic backdrop for the US dollar remains very weak, so we expect the pair to rise in the medium-term perspective.
On Tuesday, novice traders can trade in the area of 1.1745-1.1754. A bounce from this area will make long positions relevant with a target of 1.1808, and we have already seen two such bounces yesterday. A consolidation below this area will allow for short positions targeting 1.1666.
On the 5-minute timeframe, the following levels should be considered: 1.1354-1.1363, 1.1413, 1.1455-1.1474, 1.1527-1.1531, 1.1550, 1.1584-1.1591, 1.1655-1.1666, 1.1745-1.1754, 1.1808, 1.1851, 1.1908, 1.1970-1.1988. On Tuesday, there are no important events or reports scheduled in the Eurozone or the US. Therefore, we might again expect very weak movements today.
Important Note: Significant speeches and reports (always included in the news calendar) can greatly influence the movement of the currency pair. Therefore, during their release, it is advisable to trade cautiously or exit the market to avoid sharp reversals against the preceding movement.
Remember: For beginners trading in the Forex market, it is important to understand that not every trade can be profitable. Developing a clear strategy and practicing money management are keys to long-term trading success.
InstaForex analytical reviews will make you fully aware of market trends! Being an InstaForex client, you are provided with a large number of free services for efficient trading.


