 Stay
Stay 
Trading Conditions
Products
Tools


The GBP/USD pair traded on Wednesday in a manner similar to EUR/USD. Movements were chaotic and mixed, but volatility remained relatively low. The macroeconomic and fundamental backdrop was absent, and the technical picture is currently quite contradictory. We believe the holiday period should not be taken into account, since the market trades somewhat erratically at that time. The overall picture remains unchanged — an upward trend across all timeframes. Therefore, we expect the first macroeconomic data of the new year to arrive next week, at the end of the holidays. The market may begin to move more deliberately as early as Monday, providing clear trading signals and profits. The pound's prospects remain much more attractive than the dollar's.

On the 5-minute timeframe, the pound generated several trade signals on Wednesday. Was it worth trading them on December 31 before the market close? Naturally, the signals were not the best, and volatility has been disappointing for weeks and months. During the holiday week, it became even lower. We believe it is more reasonable to start trading in earnest on Monday, January 5.
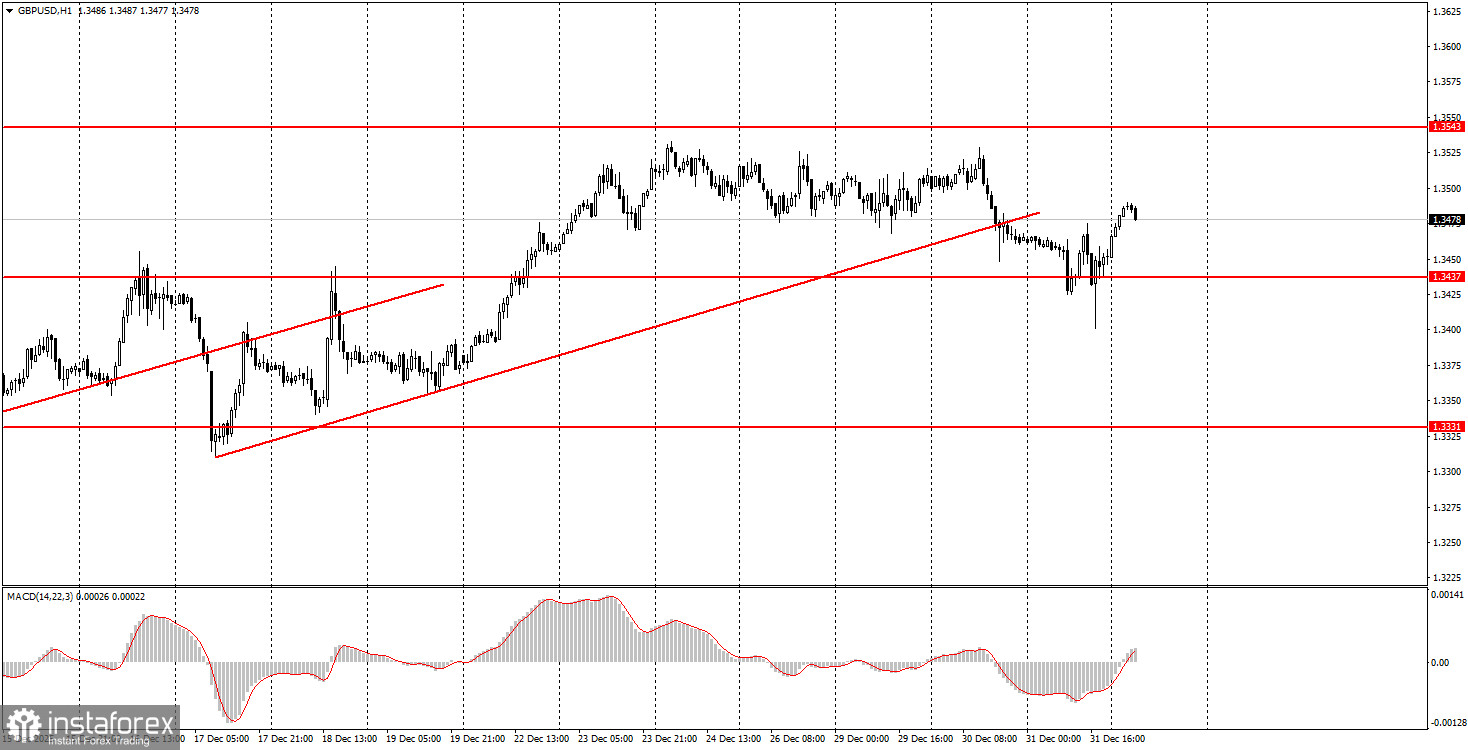
On the hourly timeframe, GBP/USD closed below the trendline, so formally, technical analysis points to a new decline of the pound at the start of the year. However, there are no global reasons for medium-term dollar strength, so we expect movement only to the north. Overall, we also expect the resumption of the 2025 global uptrend for the pair, which could take it to the 1.4000 mark within the next couple of months.
On Friday, beginner traders can consider new long positions if the price rebounds from the 1.3437–1.3446 area, with a target of 1.3529–1.3543. Short positions become relevant if the price closes below the 1.3437–1.3446 area, with a target of 1.3319–1.3331.
On the 5-minute timeframe, you can trade using the levels 1.2913, 1.2980–1.2993, 1.3043, 1.3096–1.3107, 1.3203–1.3212, 1.3259–1.3267, 1.3319–1.3331, 1.3437–1.3446, 1.3529–1.3543, 1.3574–1.3590. No significant events are scheduled in the UK or the US for Friday, and market volatility may remain weak. The market has not fully recovered from the holidays.
Support and resistance price levels — levels that serve as targets when opening buys or sells. Take Profit can be placed near them.
Red lines — channels or trendlines that display the current tendency and show the preferred trading direction.
MACD indicator (14,22,3) — histogram and signal line — an auxiliary indicator that can also be used as a source of signals.
Important speeches and reports (always listed in the news calendar) can strongly affect the currency pair's movement. Therefore, during their release, it is recommended to trade as cautiously as possible or exit the market to avoid a sharp reversal of price against the prior move.
Beginner forex traders should remember that not every trade can be profitable. Developing a clear strategy and sound money management are the keys to long-term success in trading.
InstaForex analytical reviews will make you fully aware of market trends! Being an InstaForex client, you are provided with a large number of free services for efficient trading.


