 Stay
Stay 
Trading Conditions
Products
Tools


The GBP/USD currency pair did not even try to show a downward move on Monday following the news of Maduro's arrest and deportation to the United States. The news about the capture of the Venezuelan president was probably covered by everyone who could be bothered, yet many experts concluded that this event would lead to a rise in the US dollar. We disagree with this view, and Monday convincingly proved it. The British pound neither managed nor wanted to show a decline, the price failed to break through the important and strong Senkou Span B line, and the very first significant macroeconomic report from the US knocked the dollar out cold, just as it should have.
The ISM Manufacturing PMI is considered an important report, and this was only the first major report of the week. Over recent weeks and months, we have said that we expect only growth in the GBP/USD pair, and that the trend could be considered bearish only below the Senkou Span B line. At present, the US currency is once again declining, as Donald Trump's policies are unlikely to please international investors and central banks. We believe that the 2025 trend will resume in the very near future and that the pound will reach the 1.40 level. The worse the US data released this week turns out to be, the deeper the dollar's collapse may be in the coming days.
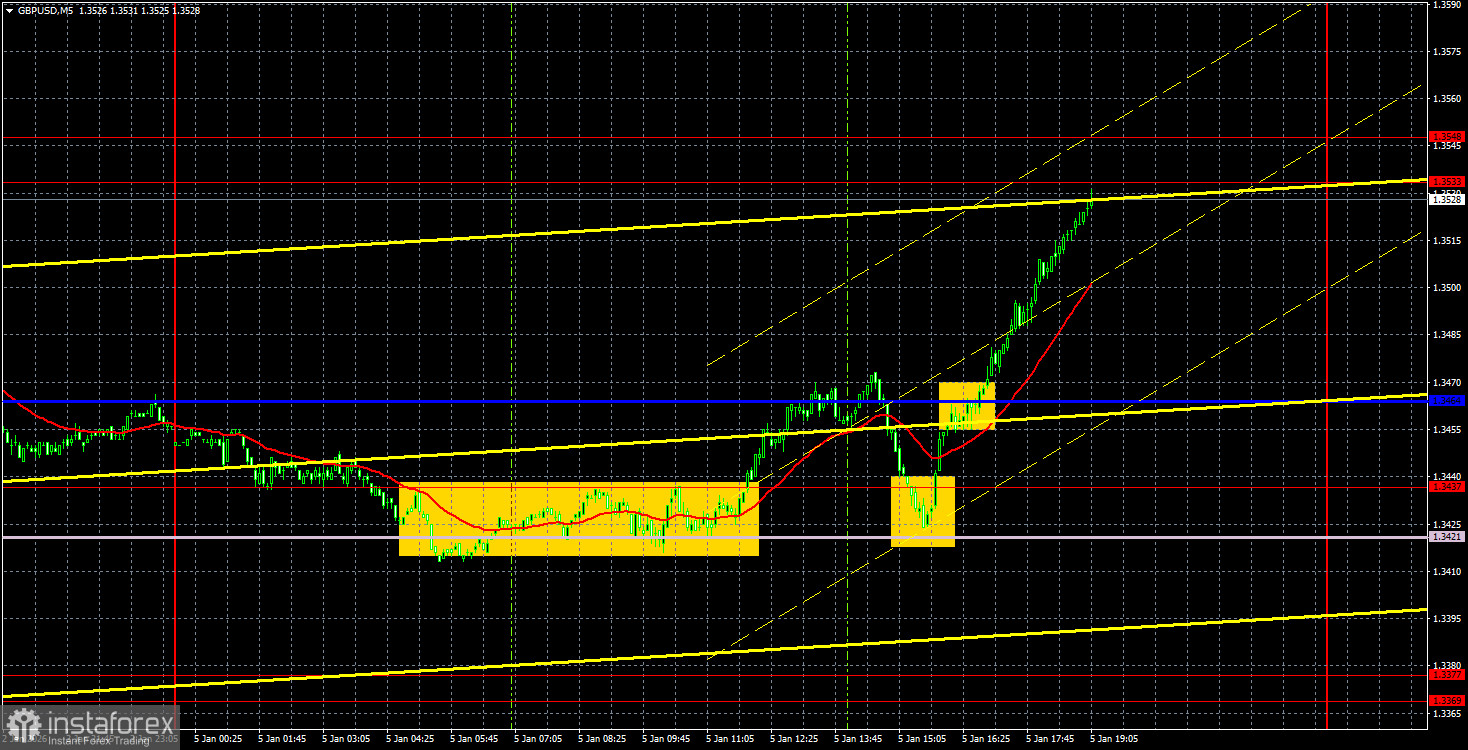
On the 5-minute timeframe, several trading signals were formed yesterday. Traders should have considered two bounces from the 1.3421–1.3437 level, which was formed by the Senkou Span B line. These two rebounds allowed traders to open long positions, and later the Kijun-sen line was overcome without difficulty. By the evening, the 1.3533–1.3548 level was reached, where profits could be taken.
COT Report
COT reports on the British pound show that in recent years the sentiment of commercial traders has been constantly changing. The red and blue lines, which display the net positions of commercial and non-commercial traders, frequently intersect and in most cases are located close to the zero line. At the moment, the lines are moving away from each other, but non-commercial traders are currently dominating with selling. Speculators are increasingly selling the pound, but as we have already said, it does not matter how low demand for the British currency is—demand for the US dollar is often even lower.
The dollar continues to decline due to Donald Trump's policies, which is clearly visible on the weekly timeframe (illustration above). The trade war will continue in one form or another for a long time, and the Fed will in any case cut rates over the next 12 months. Demand for the dollar will fall one way or another. According to the latest COT report (dated December 23) on the British pound, the "Non-commercial" group opened 1.6 thousand buy positions and closed 5.7 thousand sell positions. Thus, the net position of non-commercial traders increased by 7.3 thousand positions over the week.
In 2025, the pound has risen quite strongly, but it should be understood that there is only one reason—Donald Trump's policies. Once this factor is neutralized, the dollar may return to growth, but no one knows when that will happen.
GBP/USD 1H Analysis
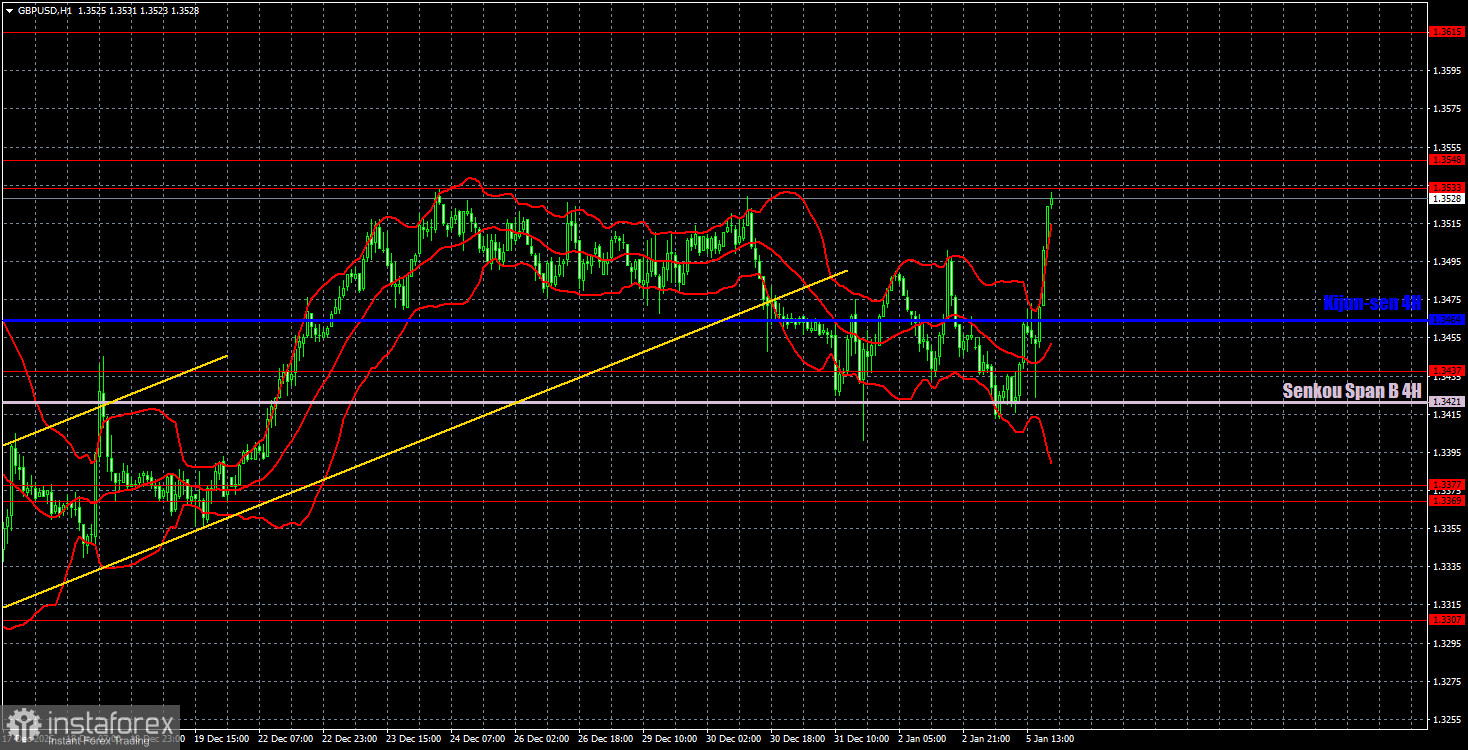
On the hourly timeframe, the GBP/USD pair continues to form an upward trend despite having broken the trend line. We believe that the rise of the pound sterling in the medium term will continue regardless of the local macroeconomic and fundamental background. The trend for the pound remains bullish on almost all timeframes. The Senkou Span B line did not allow the price to move below it, signaling a resumption of the local upward trend.
For January 6, we highlight the following important levels: 1.3042–1.3050, 1.3096–1.3115, 1.3201–1.3212, 1.3307, 1.3369–1.3377, 1.3437, 1.3533–1.3548, 1.3615, 1.3681, 1.3763. The Senkou Span B (1.3421) and Kijun-sen (1.3464) lines may also serve as signal sources. It is recommended to move the Stop Loss to breakeven once the price has moved 20 points in the correct direction. Ichimoku indicator lines may shift during the day, which should be taken into account when identifying trading signals.
On Tuesday, the UK and US economic calendars are not overloaded with important events. With some stretch, one can note only the second estimates of December services PMI. However, these are secondary data that the market is likely to ignore regardless of the outcome. Therefore, volatility may decrease today, but only briefly.
Trading Recommendations
Today, traders may consider short positions if the price rebounds from the 1.3533–1.3548 level, with the Kijun-sen line as the target. Long positions will be relevant if the price consolidates above the 1.3533–1.3548 level, with targets at 1.3615 and 1.3681.
Explanations to the Illustrations
InstaForex analytical reviews will make you fully aware of market trends! Being an InstaForex client, you are provided with a large number of free services for efficient trading.


