 Stay
Stay 
Trading Conditions
Products
Tools


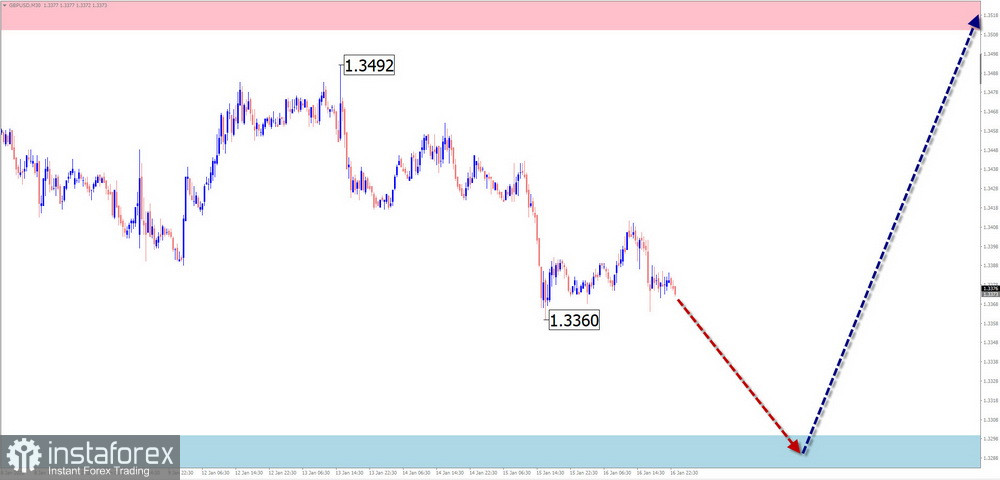
GBP/USD
The latest wave structure on the chart of the GBP/USD major pair, which remains incomplete at present, is bullish. The wave started at the beginning of last year. Since November, the final segment (C) has been developing within its structure. At the time of analysis, the wave structure does not appear fully formed. Over the past week, the price has been forming an intermediate pullback.
Over the coming week, continuation of the overall sideways movement of the British pound within a horizontal range is likely. In the first days, a decline toward the support boundaries is most probable. After that, a reversal and upward price movement can be expected. The highest volatility is likely closer to the weekend.
Resistance:
Support:
Sell: Limited potential, high risk.Buy: May be used after reversal signals appear near the support zone on your trading systems.
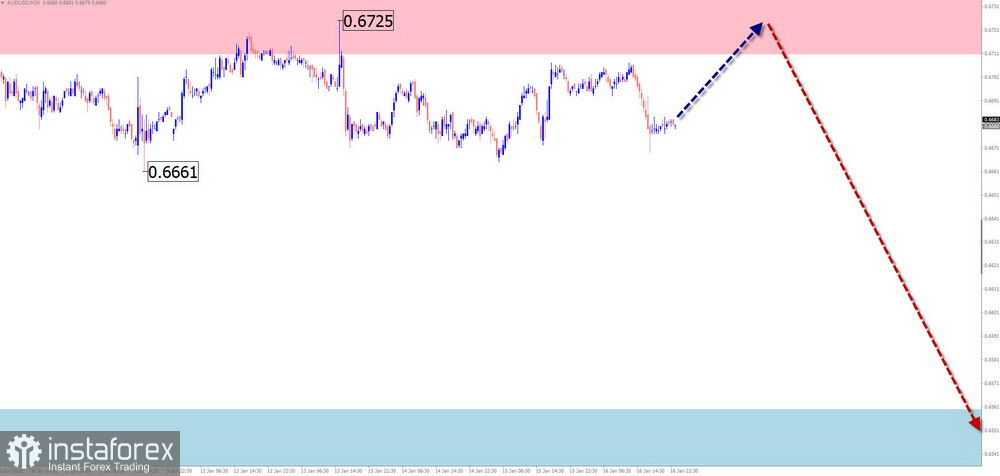
AUD/USD
The bullish wave of the Australian dollar major pair since April of last year has brought quotes into an area where potential reversal zones of different time scales are clustered. Within the wave structure, over the past month an irregular correction has been developing inside the final segment (C), in the form of a shifting flat.
During the current week, continuation of the overall sideways movement of the pair is expected. After a possible attempt to pressure the resistance zone, a change in direction and the start of a decline toward the support area can be expected.
Resistance:
Support:
Buy: Such trades are risky and may be unprofitable.Sell: Premature until confirmed reversal signals appear near the resistance zone on your trading systems.
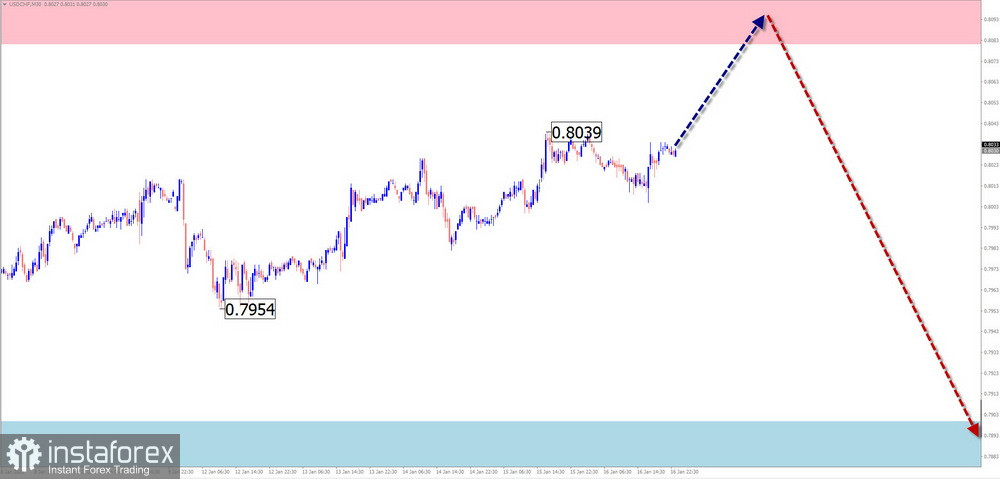
USD/CHF
The direction of short-term movements of the Swiss franc since April of last year has been defined by a bullish wave algorithm. Its structure does not indicate completion. The wave level of the model has exceeded the H4 timeframe scale. The price is moving within a narrow price channel between the nearest opposing zones. Within the structure, the corrective segment (B) is approaching completion.
In the first days of the coming week, an upward movement can be expected, with possible subsequent pressure on the upper boundary of the resistance zone. After that, a reversal and renewed downward movement can be anticipated. The calculated support lies at the upper edge of a strong potential reversal zone.
Resistance:
Support:
Sell: Will become relevant after corresponding reversal signals appear near the resistance zone on your trading systems.Buy: Low potential, high risk.
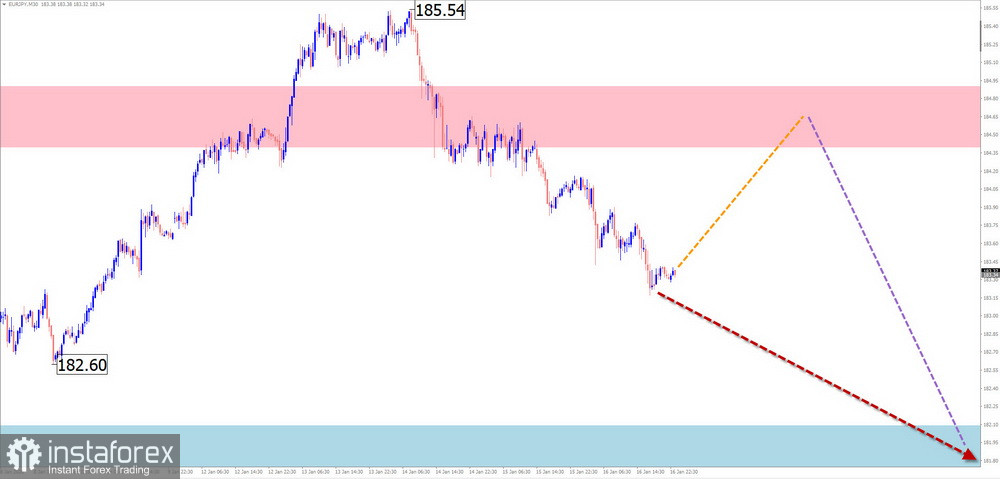
EUR/JPY
The direction of short-term price movements of the EUR/JPY pair since the end of February last year has been set by a bullish wave. This segment forms the final part of the global trend. On the chart, the wave is forming an extended flat and is not complete at the time of analysis.
During the coming week, an overall sideways course of price fluctuations is expected. After possible pressure on the resistance zone, a reversal and downward price movement can be anticipated. The calculated support runs along the upper boundary of the preliminary target zone of the entire current wave.
Resistance:
Support:
Buy: Premature until the anticipated decline is fully completed.Sell: May become possible with reduced position size after corresponding reversal signals appear near the resistance zone.
EUR/GBP
A descending correction is forming on the chart of the EUR/GBP pair. The wave dates back to April of last year and has not yet been completed. The wave structure forms a shifting flat. The beginning of the final segment (C) is forming within it.
At the beginning of the coming week, the probability of sideways movement along the support zone remains. Toward the end of the week, increased volatility, a reversal, and a resumption of upward movement in the pair's quotes can be expected.
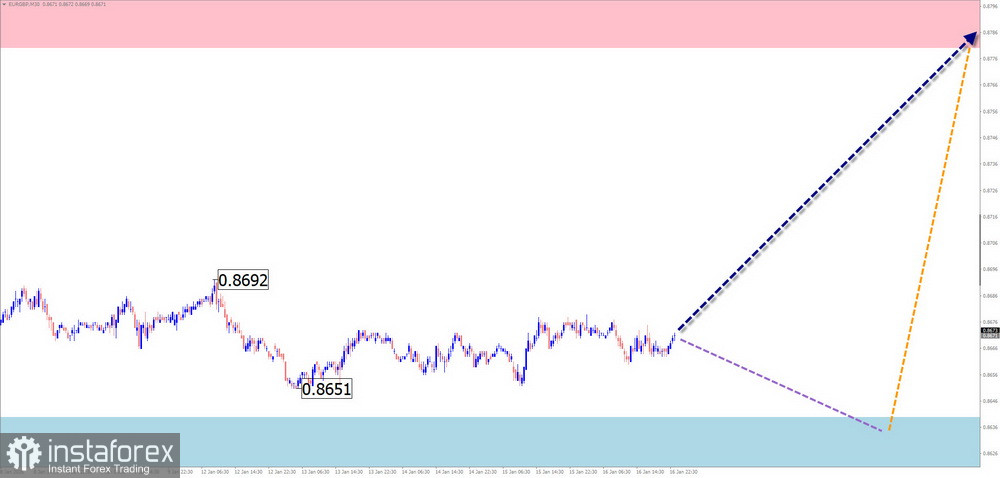
Resistance:
Support:
Sell: Premature until the upcoming pullback is completed.Buy: May become possible with reduced position size. Potential is limited by resistance.
EUR/CHF
The direction of price movement of the EUR/CHF pair since the end of November last year has been defined by a bearish wave trend. The latest wave segment (B), which is incomplete at the time of analysis, is bullish. Its potential does not exceed the correction level of the main wave.
Over the next couple of days, sideways consolidation or a short-term decline not below the calculated support can be expected. A resumption of upward price movement is more likely toward the end of the coming week. The calculated resistance marks the lower boundary of the preliminary target zone.
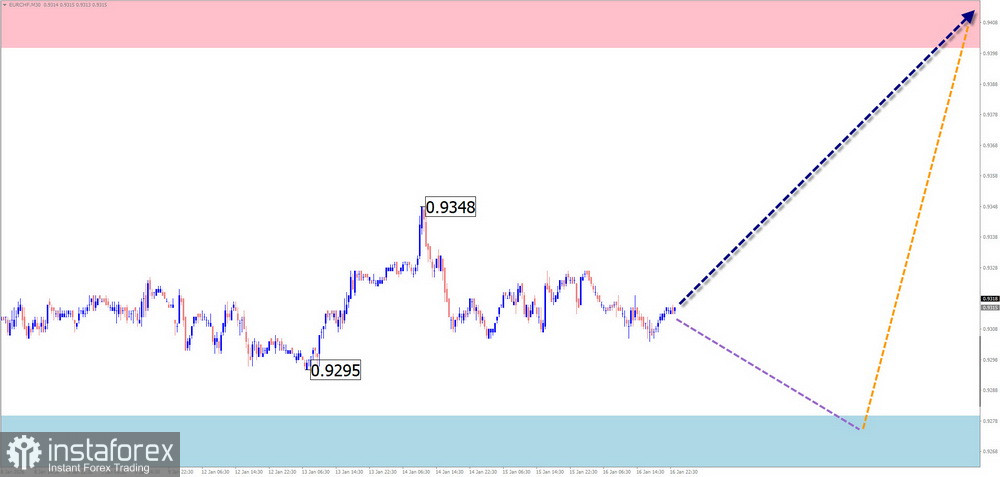
Resistance:
Support:
Sell: High risk, may lead to deposit losses.Buy: May be used in trading after corresponding signals appear on your trading systems.
Explanations:
In simplified wave analysis (SWA), all waves consist of three parts (A–B–C). On each timeframe, the latest incomplete wave is analyzed. Expected movements are shown with dashed lines.
The wave algorithm does not take into account the time duration of instrument price movements.
InstaForex analytical reviews will make you fully aware of market trends! Being an InstaForex client, you are provided with a large number of free services for efficient trading.


