 Stay
Stay 
Trading Conditions
Products
Tools


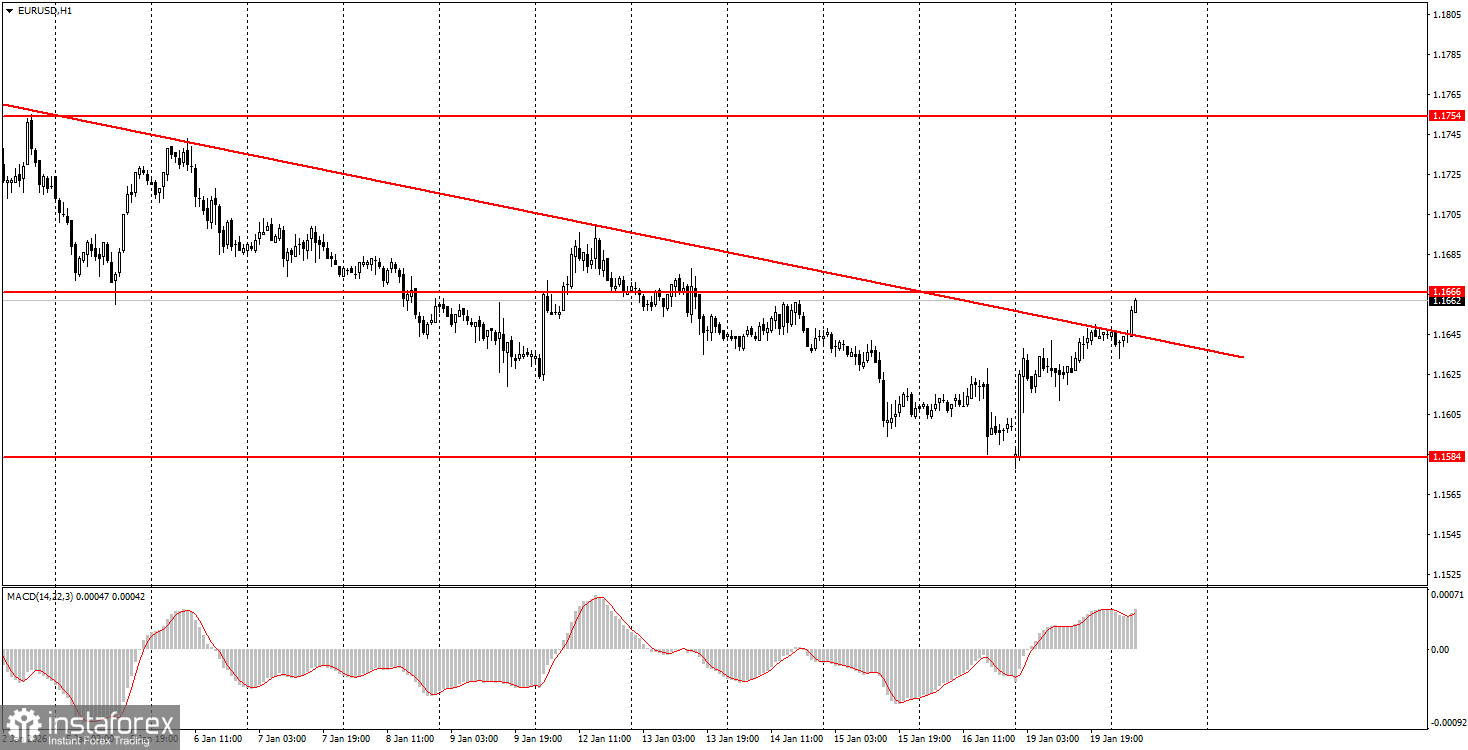
The EUR/USD currency pair was in an upward move during Monday and the Asian session on Tuesday. In our view, everything is perfectly simple. The new decline of the US dollar was caused by Donald Trump's introduction of new tariffs against a number of EU countries and the UK. Although trade agreements with the EU and Britain were reached last year, they are now under threat. It's all about Greenland. Trump believes Denmark should sell the island to America, and EU countries should not oppose the loss of an entire island, "which they cannot and will not be able to protect." Europe thinks otherwise. The FX market also holds a different view. Trump's protectionist ambitions are spreading worldwide, regularly provoking a weakening of the dollar. In our view, the dollar is falling too weakly, both in individual cases and overall. On the hourly TF, the downtrend has been cancelled; on the daily TF, the sideways channel 1.1400–1.1830 remains relevant. Thus, in the near term, we expect the pair to rise toward the 1.1800–1.1830 area.
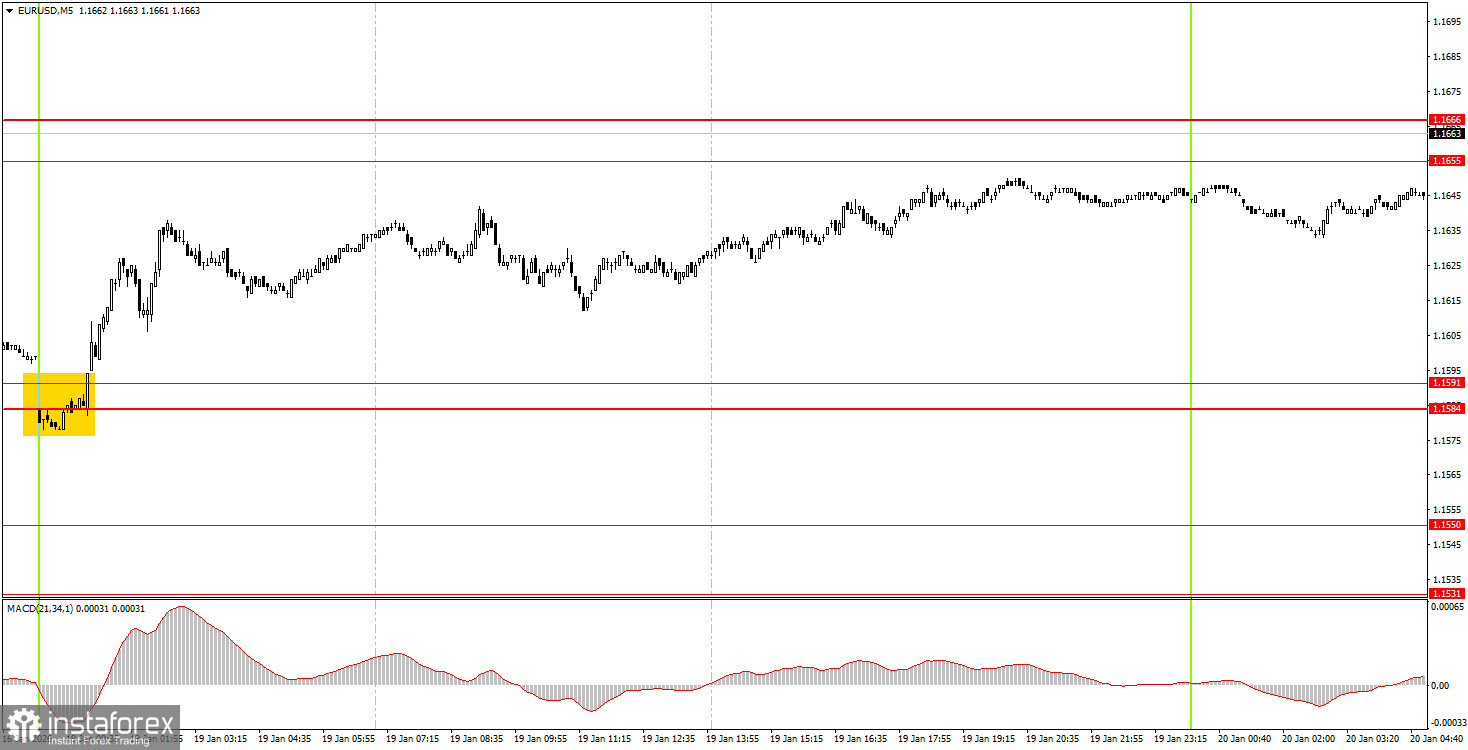
On the 5-minute TF, one trading signal was formed on Monday. At night, on market open after the weekend, the price bounced from the 1.1584–1.1591 area, moved toward the target during the day, and tonight reached the 1.1655–1.1666 area. Thus, novice traders could open long positions that yielded 40–50 pips of profit.
On the hourly timeframe, the trend changed to upward. Thus, in the near term, the pair may return to the upper boundary of the 1.1400–1.1830 sideways channel to attempt to break it again and finally end the seven-month flat. The overall fundamental and macroeconomic backdrop remains very weak for the US dollar, but the daily TF flat plays take priority, and traders pay virtually no attention to the macro backdrop.
On Tuesday, novice traders can open new long positions if the 1.1655–1.1666 area is broken, targeting 1.1745–1.1754. A rejection of price from the 1.1655–1.1666 area will make shorts relevant with a target of 1.1584–1.1591.
On the 5-minute TF, consider levels 1.1354–1.1363, 1.1413, 1.1455–1.1474, 1.1527–1.1531, 1.1550, 1.1584–1.1591, 1.1655–1.1666, 1.1745–1.1754, 1.1808, 1.1851, 1.1908, 1.1970–1.1988. Today, the EU will publish ZEW economic sentiment indices, which are unlikely to be very important. The US events calendar is empty. On the agenda are Trump's new tariffs and his aggressive stance on Greenland.
Support and resistance price levels — levels that serve as targets when opening buys or sells. Take Profit can be placed near them.
Red lines — channels or trendlines that reflect the current tendency and show which direction is preferable to trade now.
MACD indicator (14,22,3) — histogram and signal line — an auxiliary indicator that can also be used as a source of signals.
Important speeches and reports (always listed in the news calendar) can strongly affect a currency pair's movement. Therefore, during their release, trading should be done with maximum caution, or positions should be closed, to avoid a sharp price reversal against the preceding move.
Beginner forex traders should remember that not every trade can be profitable. Developing a clear strategy and effective money management are the keys to long-term trading success.
InstaForex analytical reviews will make you fully aware of market trends! Being an InstaForex client, you are provided with a large number of free services for efficient trading.


