 Stay
Stay 
Trading Conditions
Products
Tools


On Monday, the EUR/USD pair completed its second consolidation above the 127.2% corrective level at 1.1867, while traders maintained a fully bullish sentiment. Thus, the growth process may continue toward the next Fibonacci level of 161.8% at 1.1945. A consolidation of the pair below the 1.1867 level would work in favor of the U.S. dollar and lead to a certain decline toward the support level of 1.1802–1.1805.
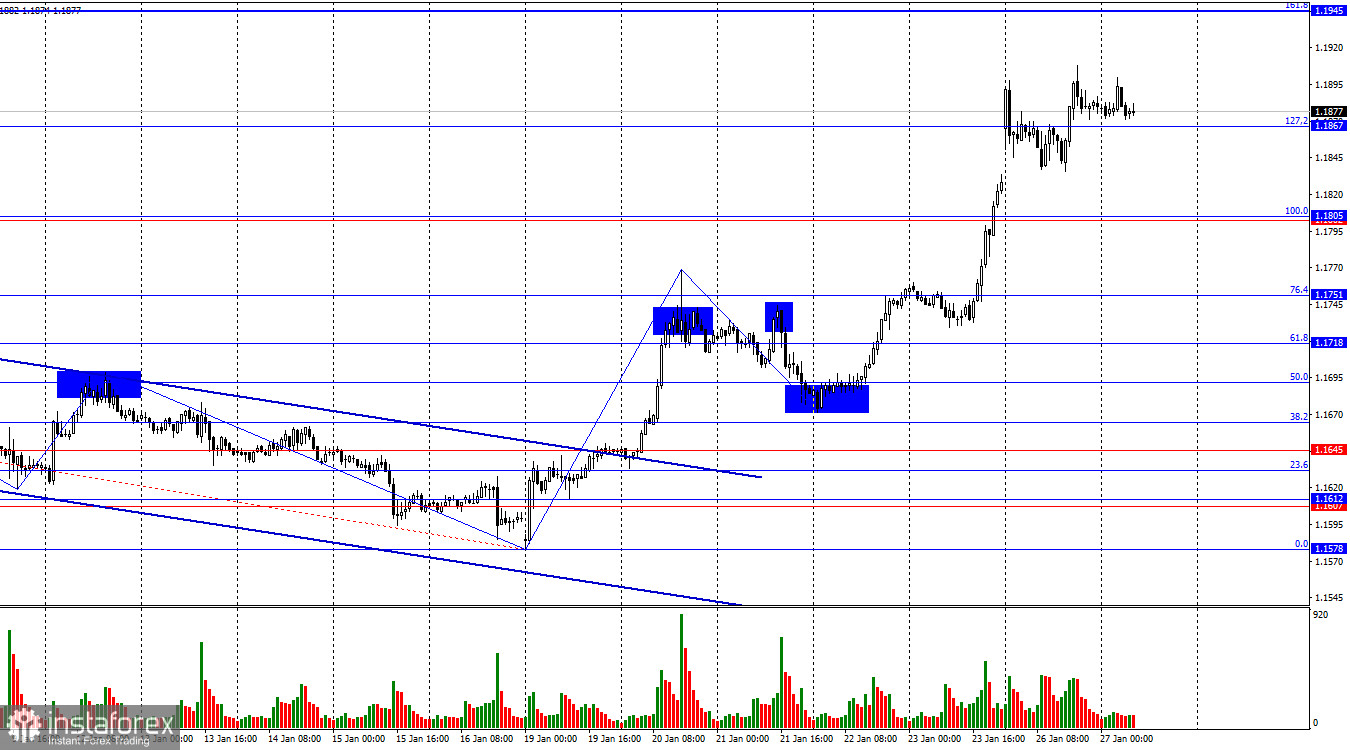
The wave situation on the hourly chart remains straightforward. The most recently completed downward wave did not break the low of the previous wave, while the latest upward wave broke the previous peak. Thus, the trend remains bullish. The bulls have launched a new offensive, which might not have happened without Donald Trump. Trump has heated up the situation around Greenland to the extreme, and the markets reacted by fleeing risky American assets amid uncertain economic prospects.
On Monday, the U.S. dollar could once again have counted on some recovery, if not for Donald Trump, who this time distinguished himself with militant rhetoric directed at Canada. Trump learned that Canada may conclude a trade agreement with China that would significantly simplify trade for both countries. Although there is currently no talk of free trade between Canada and China, Trump decided to act preemptively and warn Ottawa against the recklessness of such a move. Trump did not mince words and immediately announced that any agreement with China would automatically mean 100% tariffs for Canada. Of course, he was referring to a broad trade agreement rather than targeted ones. However, Trump is also dissatisfied with local arrangements under which Canada significantly reduces tariffs on Chinese electric vehicles, while Beijing lowers tariffs on Canadian agricultural products. The U.S. dollar continues to sit on a powder keg. Traders understand that even if Donald Trump did not introduce new tariffs today or refrained from seizing Greenland, there will be new "surprises" tomorrow. The dollar is falling in value not "because of" one reason, but due to the combined effect of everything at once.
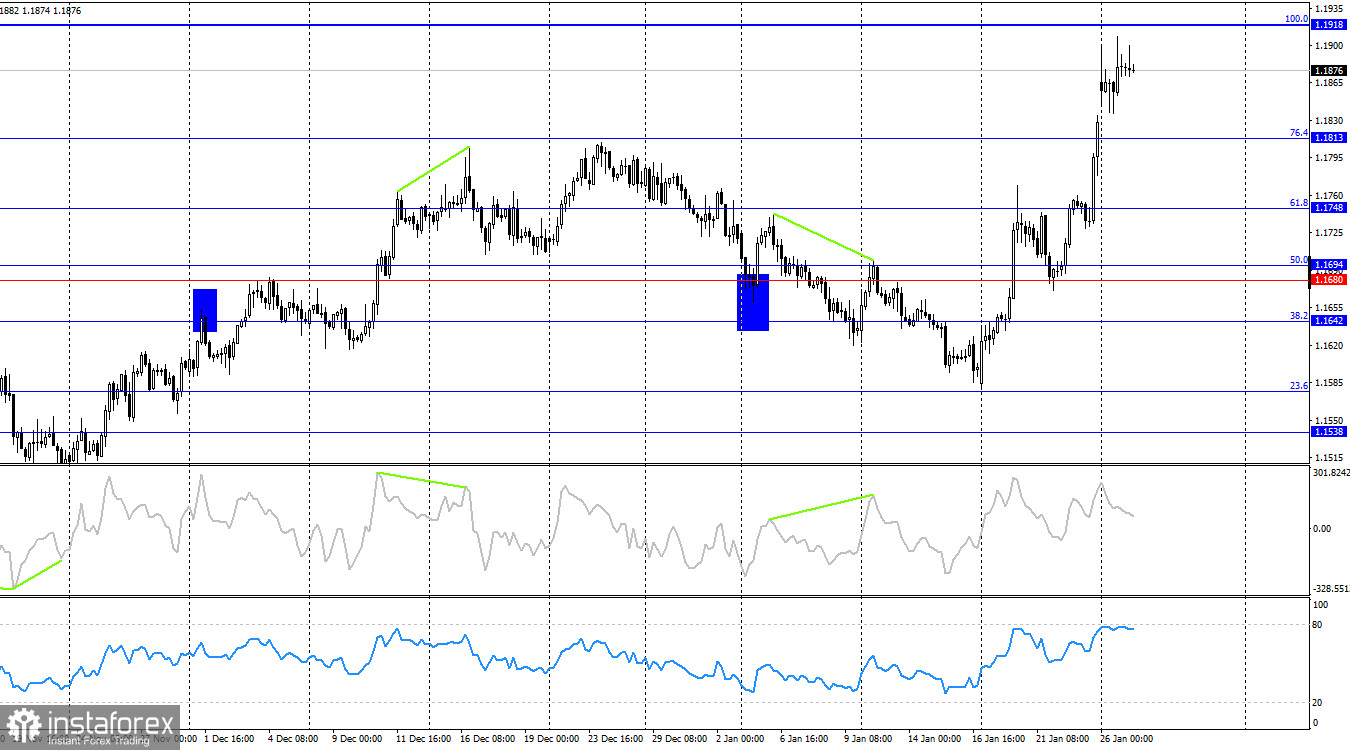
On the 4-hour chart, the pair continues its growth process and has closed above the 76.4% Fibonacci level at 1.1813. Thus, the growth may continue toward the next Fibonacci level of 100.0% at 1.1918. A rebound of quotes from the 1.1918 level would allow traders to expect a reversal in favor of the U.S. currency and a certain decline toward 1.1813. A consolidation of the pair above the 1.1918 level would increase the chances of continued growth toward the next Fibonacci level at 1.2041. No emerging divergences are observed today on any indicator.
Commitments of Traders (COT) Report:
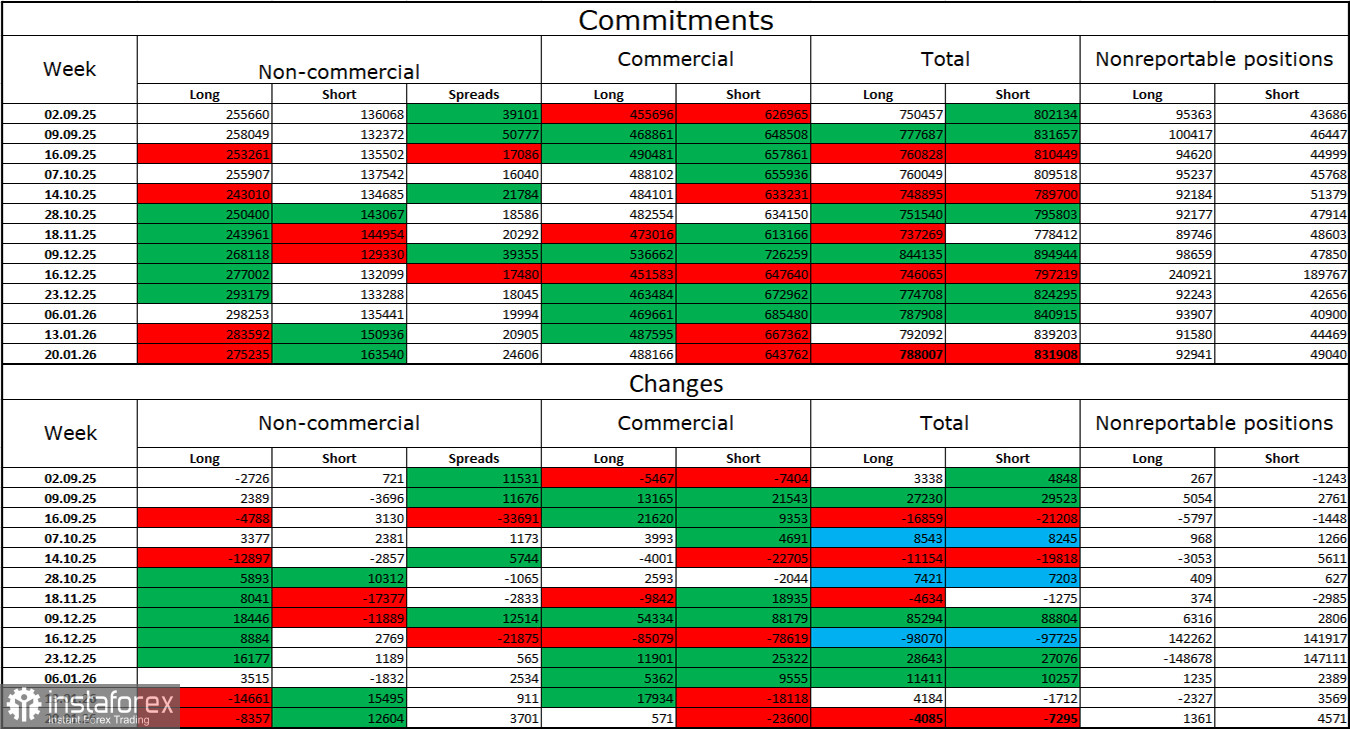
During the last reporting week, professional players closed 8,357 long positions and opened 12,604 short positions. The sentiment of the "Non-commercial" group remains bullish thanks to Donald Trump and his policies, and continues to strengthen over time. The total number of long positions held by speculators now stands at 275,000, while short positions amount to 163,000. This is almost a twofold advantage for the bulls.
For thirty-three consecutive weeks, large players were getting rid of short positions and increasing long positions. Then the "shutdown" began, and now we are seeing the same picture again: professional traders continue to build up long positions. Donald Trump's policies remain the most significant factor for traders, as they create numerous problems that will have long-term and structural consequences for the United States. For example, a deterioration in the labor market. Traders fear a loss of Federal Reserve independence in 2026 and Donald Trump's geopolitical ambitions.
News Calendar for the U.S. and the European Union:
The economic calendar for January 27 contains two events, neither of which is of any interest. The impact of the news background on market sentiment on Tuesday may be extremely weak.
EUR/USD Forecast and Trader Advice:
Selling the pair is possible today if it consolidates on the hourly chart below the 1.1867 level, with targets at 1.1805 and 1.1751. Buying was possible after a rebound from the 1.1686 level on the hourly chart with targets at 1.1731 and 1.1802. All targets were achieved. New buying opportunities emerged after a close above the 1.1867 level with a target of 1.1945.
Fibonacci grids are drawn from 1.1805–1.1578 on the hourly chart and from 1.1918–1.1471 on the 4-hour chart.
InstaForex analytical reviews will make you fully aware of market trends! Being an InstaForex client, you are provided with a large number of free services for efficient trading.


