 Stay
Stay 
Trading Conditions
Products
Tools


Bitcoin has been in a state of reflection for several days. After reaching the $60,000 level during the latest drop, there was a subsequent rebound of $10,000 upwards, after which all movements came to a halt. Over the weekend, market volatility was minimal, and Monday did not see an increase in it either. Traders are reminded that, no matter how attractive the current levels may seem (for both buying and selling), it's best to adhere strictly to the trading strategy. Currently, the ICT strategy does not provide any new entry points. The nearest area of Interest (POI) on the daily timeframe is in the range of $79,500 – $81,100. Thus, until new patterns are formed, entering a trade "in the air" in these areas is meaningless.
On the 4-hour timeframe, we noted a "bullish" IFVG, from which long positions could theoretically be considered. However, after several days, traders can see for themselves how prudent it was to consider longs from this pattern within the framework of the correction. The price reacted to the pattern twice but failed to show strong movement. Therefore, we maintain our opinion that trading corrections in a strong downward trend is not the best idea.
Meanwhile, many retail traders are forecasting further declines for the world's first cryptocurrency. Unlike various funds, banks, and so-called "crypto-experts" who always predict only growth. For instance, traders note that the price is significantly below the 50-week exponential moving average. There is also mention of a test of the 200-week moving averages, which previously ended in further price declines. Currently, only Kathy Wood, Michael Saylor, and other experts who rely on their own investments believe in a new rise in Bitcoin.
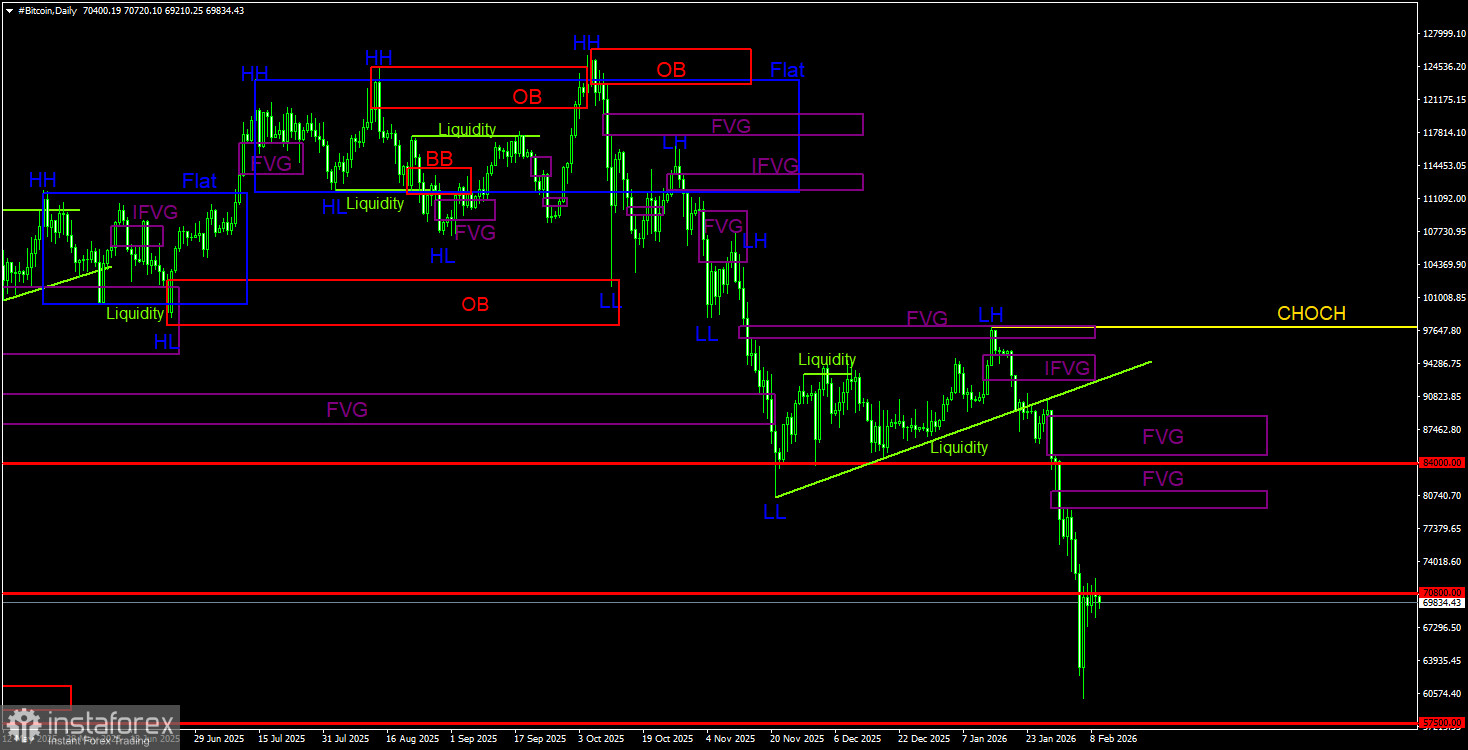
On the daily timeframe, Bitcoin continues to form a downward trend. The trend structure is bearish, and the CHOCH line currently sits at $97,900. Only above this level can we consider the downward trend to be over. "In 2026, Bitcoin might fall to $60,000." This is what we said just a week ago. Bitcoin reached the $60,000 level in a matter of days... Recall that a sell signal was formed within the "bearish" FVG ($96,900 – $98,000) and was subsequently confirmed. Thus, traders could capture almost the entire latest movement. The current target remains at the $57,500 level – corresponding to the 61.8% Fibonacci. On the daily timeframe, the nearest POI area for selling is in the range of $79,500 – $81,100.
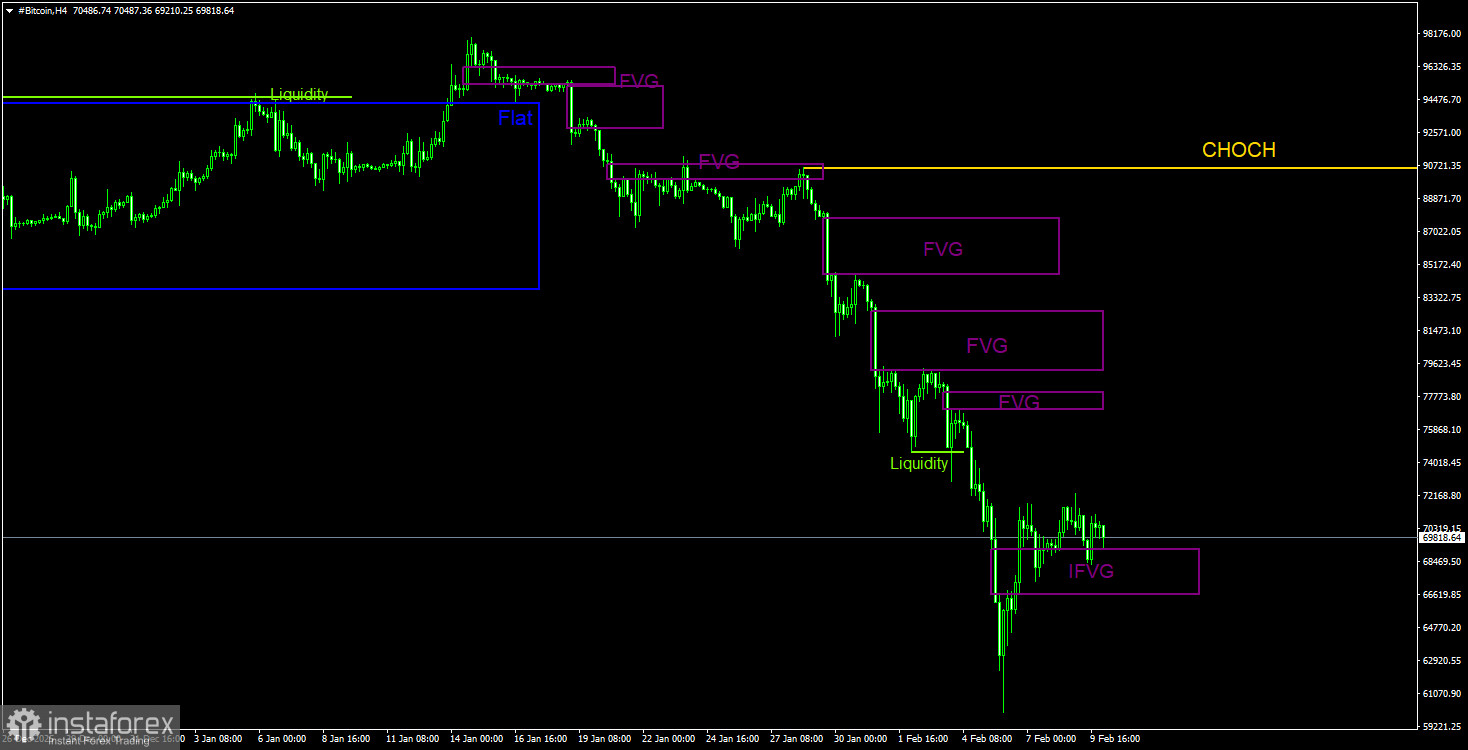
On the 4-hour timeframe, the price continues to form a downward structure. The CHOCH line is at $90,560, and only above this level can we discuss transforming the trend to an upward one. However, at the moment, there are no signs that Bitcoin could end its decline anytime soon. The latest bearish FVG was ignored and is now a bullish IFVG. Thus, theoretically, this pattern could be used as a source of buying signals. However, we see that the pattern has been completed, and there has been virtually no reaction to it. In any case, any rise now is by default a correction.
Bitcoin continues to form a full-blown downward trend. We continue to expect a decline towards $57,500 (the 61.8% level from a three-year upward trend), and there are currently no signs of a trend reversal. Among the POI areas for selling on the daily timeframe, the last bearish FVG can be noted, which Bitcoin is still far from reaching. The decline may resume without the need to work through the nearest POI area.
InstaForex analytical reviews will make you fully aware of market trends! Being an InstaForex client, you are provided with a large number of free services for efficient trading.


