 Stay
Stay 
Trading Conditions
Products
Tools


The EUR/USD currency pair showed no notable movements on Thursday or Friday. Both days passed with minimal volatility just above the critical Kijun-sen line. Thus, it is currently even difficult to say what kind of trend has formed in the market. By all indications on the higher timeframes, it is upward. However, on the hourly timeframe, the price is below the Senkou Span B line, above the critical line, not in a sideways channel, without a trend line. It seems that a spring is compressing in the market, which will "shoot" in the near future. And the "shot" may not please many traders.
Last week, including Friday, the market virtually ignored all the most important events. The Nonfarm Payrolls report and the unemployment rate elicited a rather ambiguous reaction, while the consumer price index was completely ignored. The market traded only on Monday after news of the ban on Chinese banks investing in U.S. government securities became known. On that day, the dollar lost about 100 pips.
Since the market is currently responding almost not at all to macroeconomic events, and there are no significant fundamental events, we can only carefully monitor the technical changes. We believe that, in the near future, trading can be done either in the area of 1.1830-1.1848 (together with the Kijun-sen line) or in the area of 1.1907-1.1927 (together with the Senkou Span B line). This results in a sideways channel of 1.1830-1.1927.
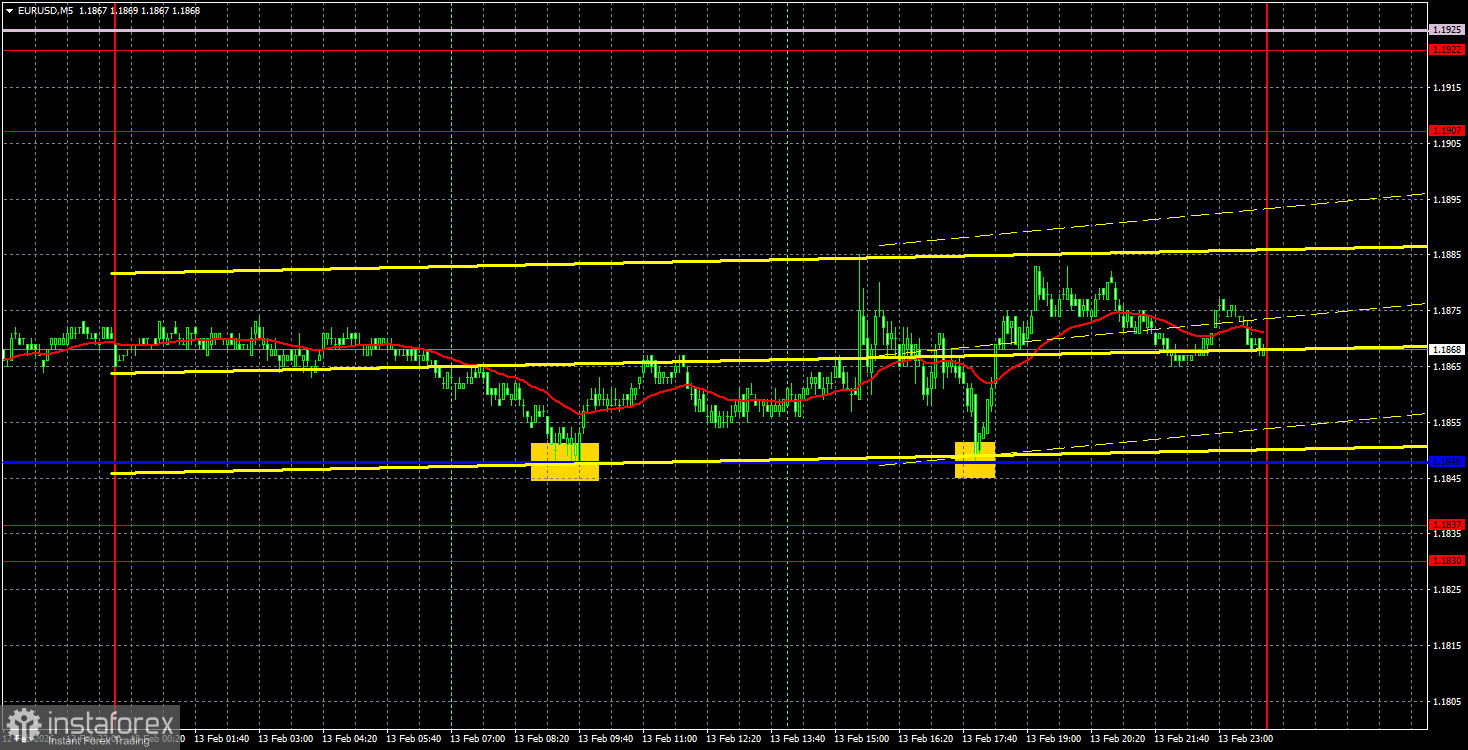
On the 5-minute timeframe, two trading signals were formed on Friday. The price bounced off the Kijun-sen line twice, each time offering traders an opportunity to open long positions. In both cases, the price rose about 20-25 pips. Thus, there could be no losses from these trades, but making a profit was rather problematic.
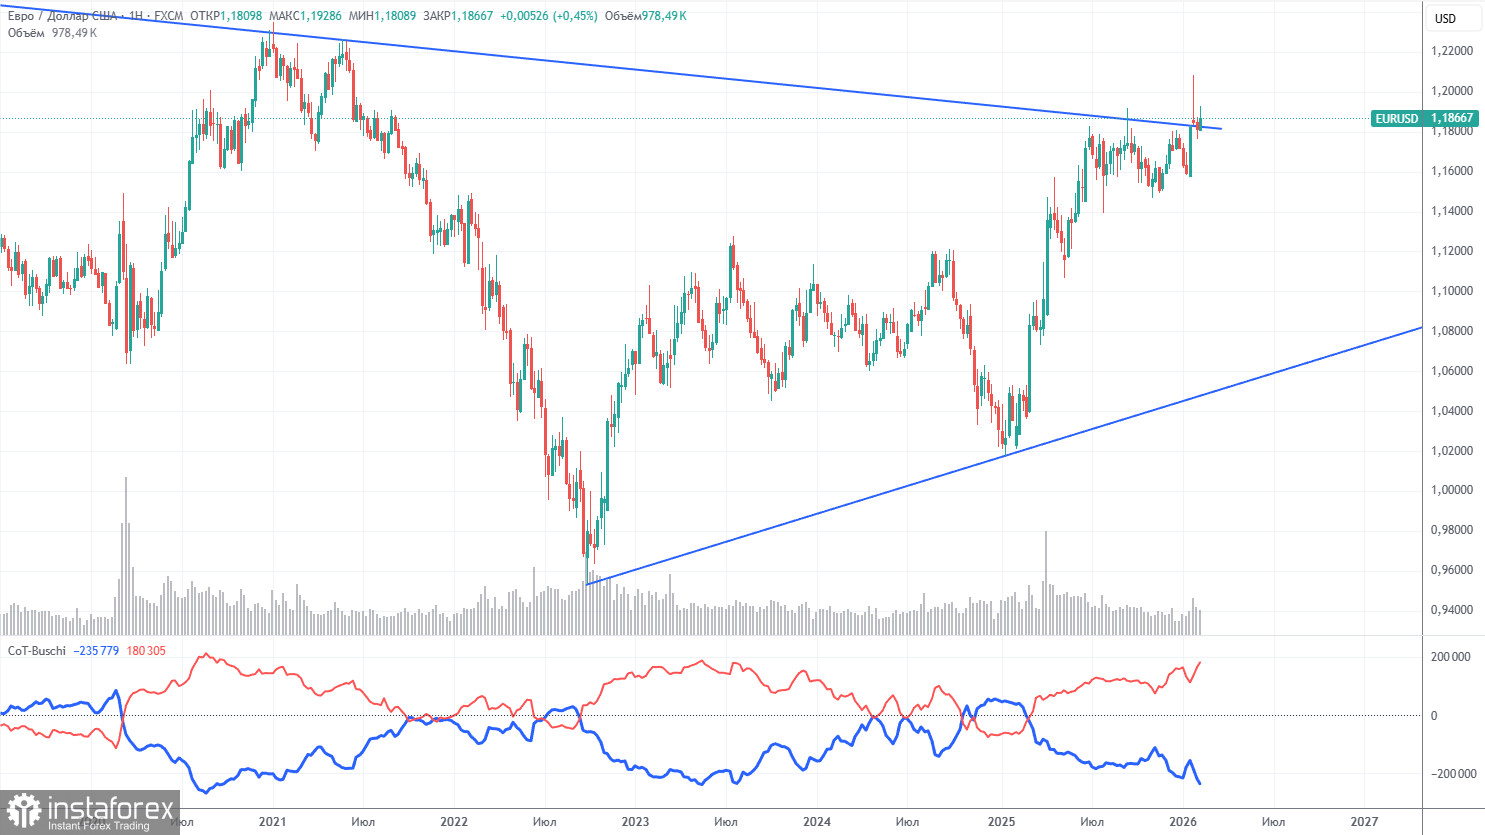
The last COT report is dated February 10. The illustration on the weekly timeframe clearly shows that the net position of non-commercial traders remains "bullish." Since Trump took office as President of the USA for the second time, only the dollar has been falling. We cannot say that the decline of the U.S. currency will continue with a probability of 100%, but current developments worldwide hint at this possibility.
We still do not see any fundamental factors that would strengthen the European currency, but there are sufficient factors for the decline of the American dollar. The global downward trend is still in place, but what matters now is where the price has moved in the last 18 years. In the last three years, a new upward trend has formed, and a breakout of the global downward trend line has occurred. Thus, the path further upward is clear.
The indicator's red and blue lines continue to indicate the preservation of the "bullish" trend. Over the past reporting week, the number of longs in the "Non-commercial" group increased by 16,400, while the number of shorts decreased by 500. Accordingly, the net position rose by another 16,900 contracts over the week.
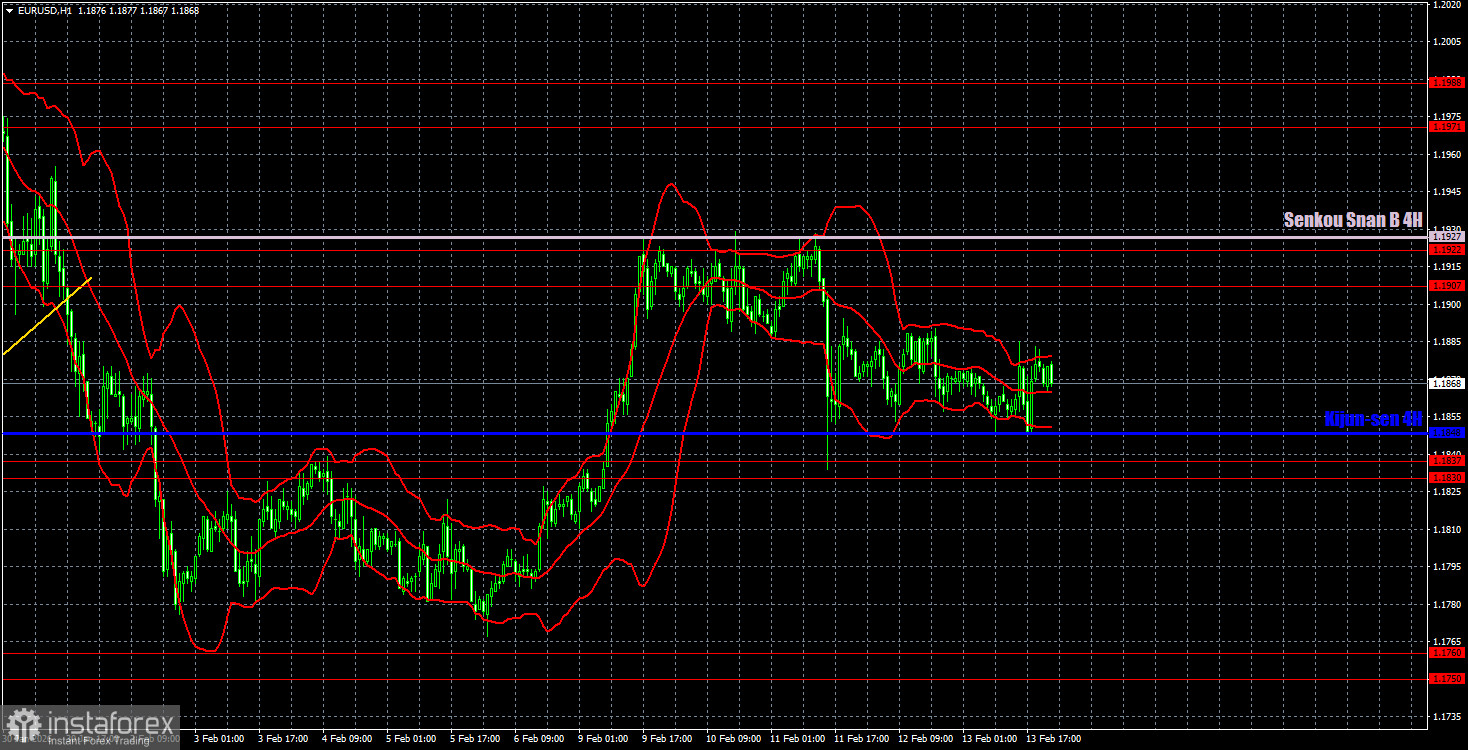
On the hourly timeframe, the EUR/USD pair remains below the Senkou Span B line, hindering its upward advance. The pair exited the sideways channel of 1.1400-1.1830 at the beginning of the year, where it spent seven months, officially resuming the upward trend. To technically restore the upward trend on the hourly timeframe, the price must now consolidate above the Senkou Span B line. In the near future, trading may take place between the levels of 1.1830 and 1.1927.
For February 16, we highlight the following levels for trading: 1.1362, 1.1426, 1.1542, 1.1604-1.1615, 1.1657-1.1666, 1.1750-1.1760, 1.1830-1.1837, 1.1907-1.1922, 1.1971-1.1988, 1.2051, 1.2095, as well as the Senkou Span B line (1.1927) and the Kijun-sen line (1.1848). The Ichimoku indicator lines may move throughout the day, which should be taken into account when determining trading signals. Do not forget to set the Stop Loss order to break-even if the price moves 15 pips in the right direction. This will protect against possible losses if the signal turns out to be false.
On Monday, a report on industrial production is scheduled for publication in the European Union, while the U.S. event calendar is empty. Most likely, we are in for another "boring Monday" with movements within the sideways channel of 1.1830-1.1927.
On Monday, traders may trade from the area of 1.1907-1.1927 or from the area of 1.1830-1.1848. New longs will become relevant if the price consolidates above 1.1907-1.1927 with a target of 1.1971-1.1988. Short positions can be considered upon a bounce from the area of 1.1907-1.1927 with a target of 1.1848.
Support and resistance price levels – thick red lines around which the movement may end. They are not sources of trading signals.
Kijun-sen and Senkou Span B lines – lines of the Ichimoku indicator transferred to the hourly timeframe from the 4-hour timeframe. They are strong lines.
Extreme levels – thin red lines from which the price has previously bounced. They are sources of trading signals.
Yellow lines – trend lines, trend channels, and any other technical patterns.
Indicator 1 on COT charts – the size of the net position of each category of traders.
InstaForex analytical reviews will make you fully aware of market trends! Being an InstaForex client, you are provided with a large number of free services for efficient trading.


