empty
 
 
You are about to leave
www.instaforex.eu >
a website operated by
INSTANT TRADING EU LTD
Open Account

17.02.202606:53 Forex Analysis & Reviews: How to Trade the GBP/USD Currency Pair on February 17? Simple Tips and Trade Analysis for Beginners

Relevance up to 23:00 2026-02-17 UTC--5
This information is provided to retail and professional clients as part of marketing communication. It does not contain and should not be construed as containing investment advice or investment recommendation or an offer or solicitation to engage in any transaction or strategy in financial instruments. Past performance is not a guarantee or prediction of future performance. Instant Trading EU Ltd. makes no representation and assumes no liability as to the accuracy or completeness of the information provided, or any loss arising from any investment based on analysis, forecast or other information provided by an employee of the Company or otherwise. Full disclaimer is available here.

Analysis of Monday's Trades:

1H Chart of the GBP/USD Pair

Exchange Rates 17.02.2026 analysis

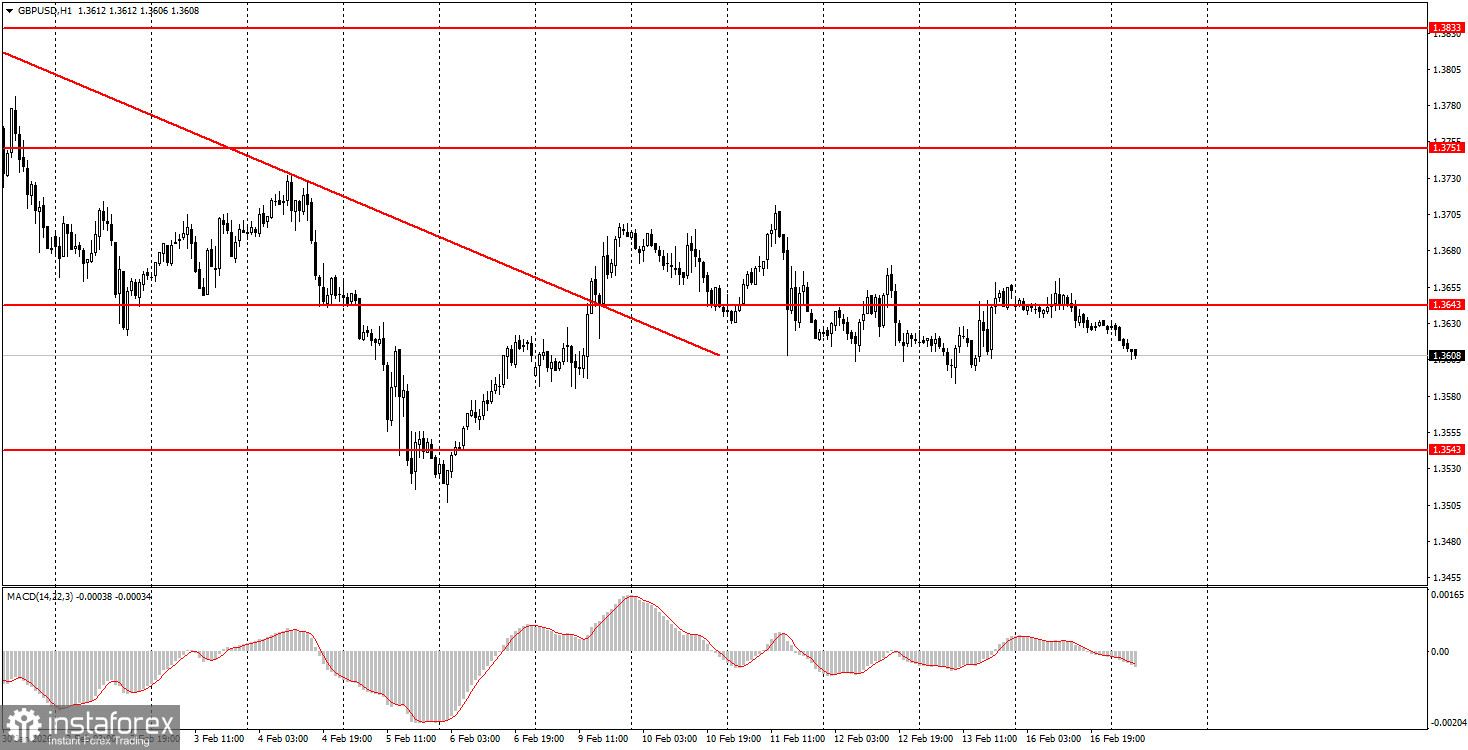
The GBP/USD pair also traded with minimal volatility on Monday, with no fundamental or macroeconomic support, and remained within a clearly visible sideways channel on the hourly timeframe. Overall, since last Monday, when dollar quotes across the market plummeted, and the pair broke through the descending trend line, we have not seen any significant movements. For five consecutive days, the British pound has been sliding down with minimal volatility, ignoring the most important macroeconomic reports. Thus, it can be said that the market is trading by its own rules—if one can call it trading at all. Today, several important reports will be published in the UK, but it's worth noting that last week, both in the U.S. and the UK, several important reports were also released. The nature and quality of the movements can easily be judged by looking at virtually any chart.

5M Chart of the GBP/USD Pair

Exchange Rates 17.02.2026 analysis

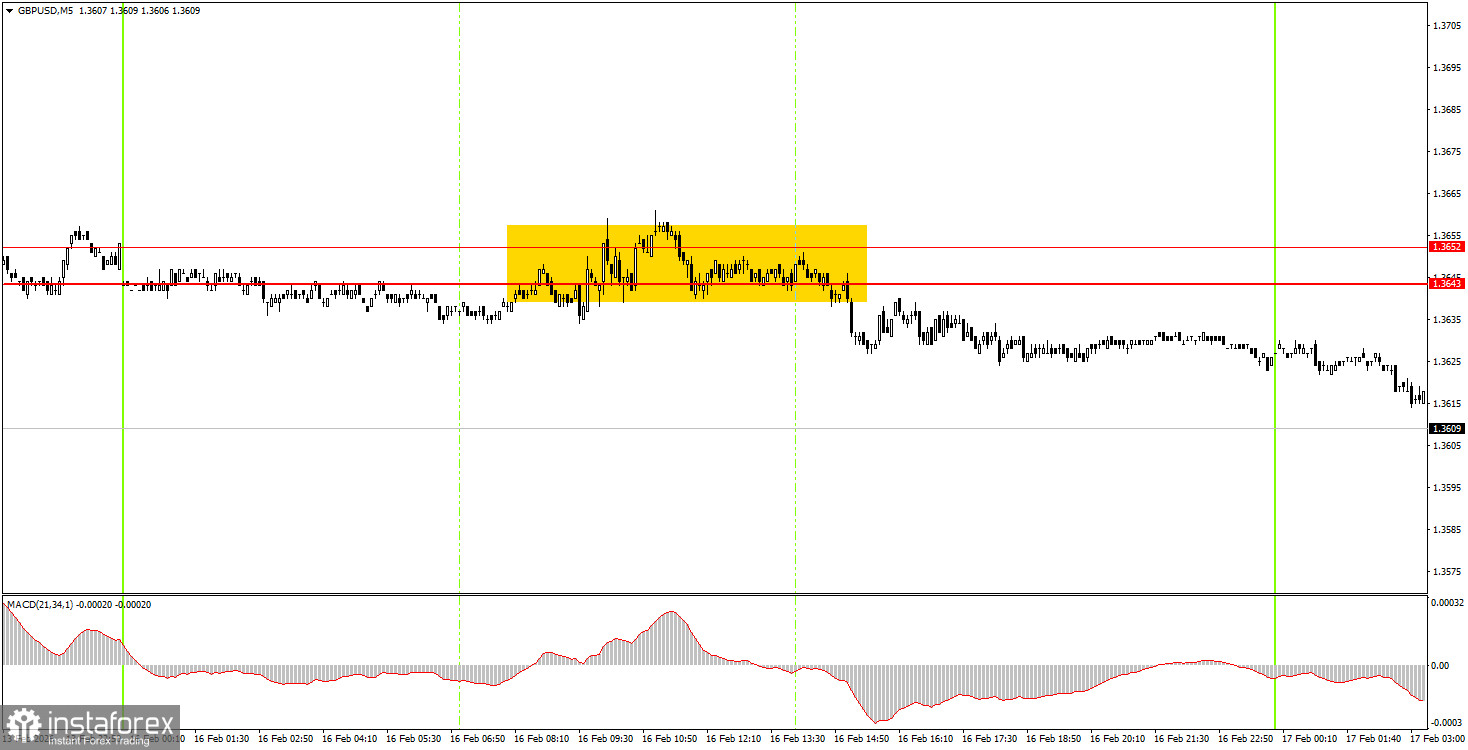
On the 5-minute timeframe, one trading signal was formed on Monday. For approximately 6 hours, the pair formed a bounce from the area of 1.3643-1.3652 and eventually created a sell signal, allowing beginner traders to open a short position. Given the current low volatility, it might take several weeks for a single trading signal to yield a significant profit.

How to Trade on Tuesday:

On the hourly timeframe, the GBP/USD pair has broken the downward trend. There are no global grounds for medium-term dollar growth, so we expect the global upward trend from 2025 to continue, which could push the pair to the 1.4000 mark. In recent weeks, the situation has often not favored the British currency, and the market, after several active weeks in mid-January, is again slipping into stagnation.

On Tuesday, beginner traders can stay in short positions, as the pair has bounced from the 1.3643-1.3652 area, targeting 1.3529-1.3543. Consolidation above the area of 1.3643-1.3652 would allow for opening long positions with a target of 1.3741-1.3751.

On the 5-minute timeframe, levels to trade include 1.3319-1.3331, 1.3365, 1.3403-1.3407, 1.3437-1.3446, 1.3484-1.3489, 1.3529-1.3543, 1.3643-1.3652, 1.3741-1.3751, 1.3814-1.3832, 1.3891-1.3912, 1.3975.

On Tuesday, the UK is scheduled to report on unemployment, unemployment claims, and wages. The reaction to these data may be minimal. In the U.S., the macroeconomic background is even weaker and less interesting, with a weekly ADP labor market report.

Main Rules of the Trading System:

  1. The strength of the signal is determined by the time it takes to form (rebound or breaking through the level). The shorter the time, the stronger the signal.
  2. If two or more trades were opened around a particular level based on false signals, all subsequent signals from that level should be ignored.
  3. In a flat market, any pair can generate numerous false signals or no signals at all. In any case, it is best to stop trading at the first signs of a flat.
  4. Trades are opened during the time period between the start of the European session and until the middle of the American session, after which all trades should be manually closed.
  5. On the hourly timeframe, signals from the MACD indicator should ideally be traded only when there is good volatility and a trend confirmed by a trend line or channel.
  6. If two levels are too close to each other (ranging from 5 to 20 pips), they should be considered as a support or resistance area.
  7. After moving 20 pips in the correct direction, it is advisable to set the Stop Loss to break-even.

What's on the Charts:

  • Support and resistance levels are targets for opening buy or sell trades. Take Profit levels can be placed around them.
  • Red lines indicate channels or trend lines that reflect the current trend and indicate the preferred direction for trading now.
  • The MACD indicator (14,22,3) – the histogram and signal line – serves as a supplementary indicator that can also be used as a source of signals.
  • Important speeches and reports (always found in the news calendar) can significantly influence the movement of the currency pair. Therefore, during their release, trading should be conducted with maximum caution, or it is advised to exit the market to avoid a sharp price reversal against the preceding movement.
  • Beginners trading in the Forex market should remember that not every trade can be profitable. Developing a clear strategy and practicing sound money management are the keys to long-term trading success.
Paolo Greco
Analytical expert of InstaForex
© 2007-2026

Open trading account

InstaForex analytical reviews will make you fully aware of market trends! Being an InstaForex client, you are provided with a large number of free services for efficient trading.


You are now leaving www.instaforex.eu, a website operated by INSTANT TRADING EU LTD
Can't speak right now?
Ask your question in the chat.
Widget callback

Turn "Do Not Track" off