 Stay
Stay 
Trading Conditions
Products
Tools


The EUR/USD currency pair traded with miserable volatility of around 40 pips on Friday. There were not many events that day, but there were still some. In Germany, several important reports were released regarding unemployment, jobless claims, and inflation for February. While unemployment data proved "bland," inflation slowed to 1.9%, confirming a broader European trend. Inflation is, of course, one of the factors putting pressure on the euro. Last month, the EU consumer price index slowed to 1.7%, sparking immediate rumors of a possible new easing of the ECB's monetary policy. However, a few days later, Christine Lagarde stated that such a decision is not planned in the near future and that the mid-term trend of the indicator matters more than just one report. Therefore, the threat of rate cuts does not currently loom over the euro.
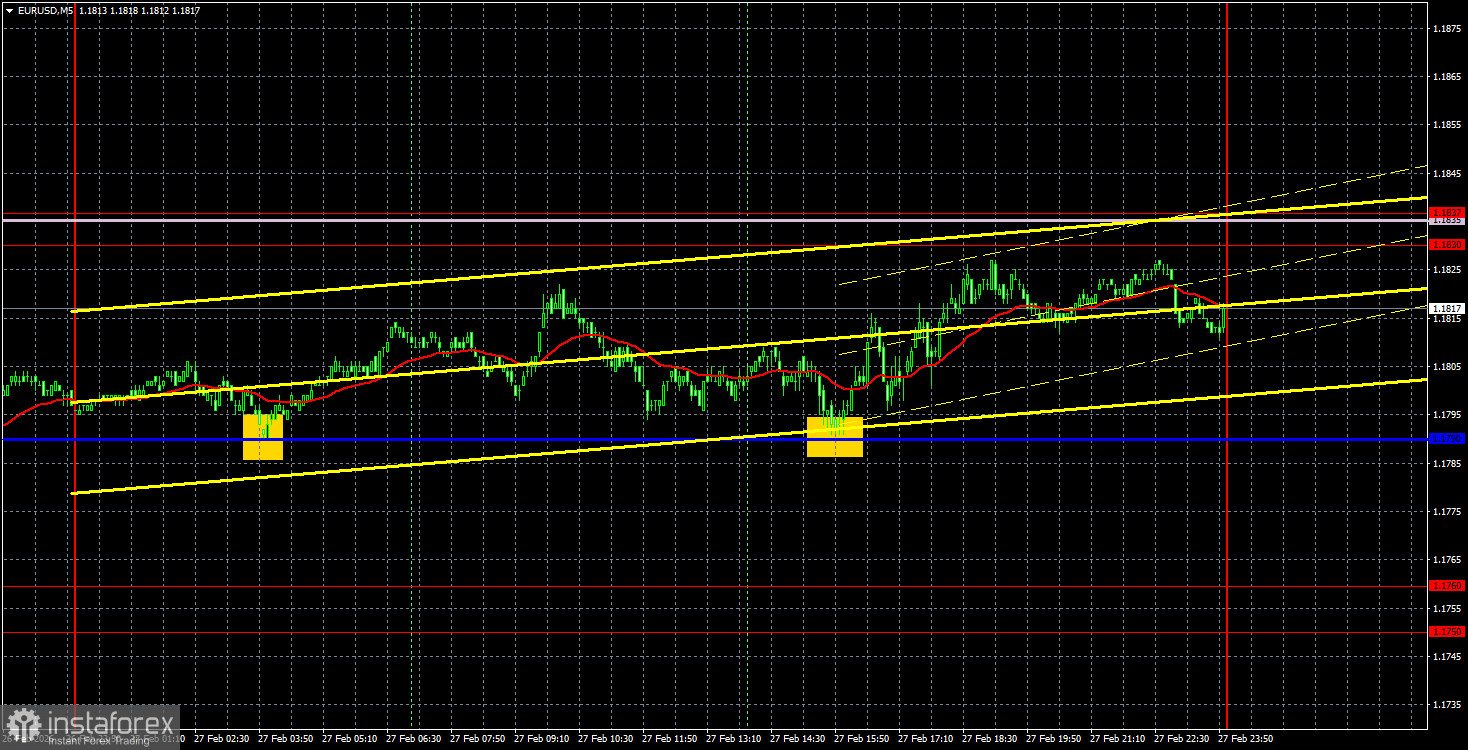
From a technical standpoint, we are experiencing total flatness. In previous articles, we mentioned that trading in February could only be profitable on lower timeframes, as the volatility throughout the month was extremely weak. Last week, trading was very problematic, even on the 5-minute timeframe. The hourly timeframe clearly shows that the price broke the descending trend line but failed to overcome the Senkou Span B line, so the euro has been in a flat trend for a week now.
On the 5-minute timeframe, two good buy signals were formed on Friday. The price bounced off the critical line twice, but the first bounce occurred overnight, making it difficult to act on. The second bounce happened during the US session. How much could have been earned on the long position, considering that the target level 1.1830 was almost reached? About 20 pips.
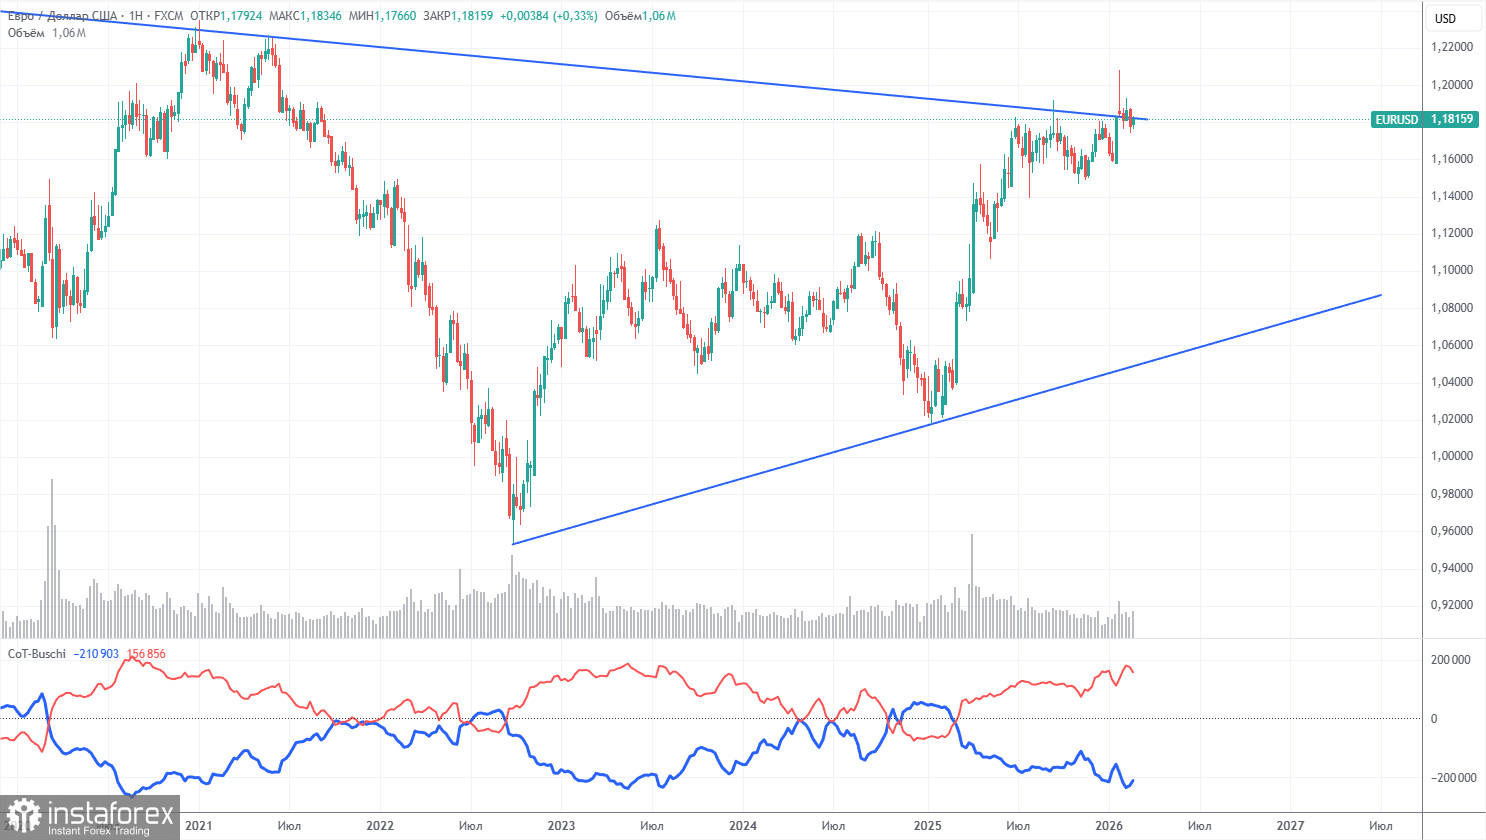
The latest COT report was dated February 24. From the illustration on the weekly timeframe, it is clear that the net position of non-commercial traders remains "bullish," and since Trump took office for a second time, the dollar has been falling. We cannot say that the decline of the US currency will continue with 100% probability, but the current state of global events suggests this is a possibility.
We still do not see any fundamental factors that would strengthen the euro, while there remain plenty of factors that would weaken the dollar. The global downward trend is still intact, but what matters now is where the price has moved over the past 18 years. Since September 2022, a new upward trend has formed, breaking the previous global descending trend line. Thus, the way north is open.
The position of the red and blue lines of the indicator continues to indicate the preservation of the "bullish" trend. Over the past reporting week, the number of long positions held by the "Non-commercial" group decreased by 16,700, while the number of shorts increased by 900. Accordingly, the net position for the week fell by 15,800 contracts.
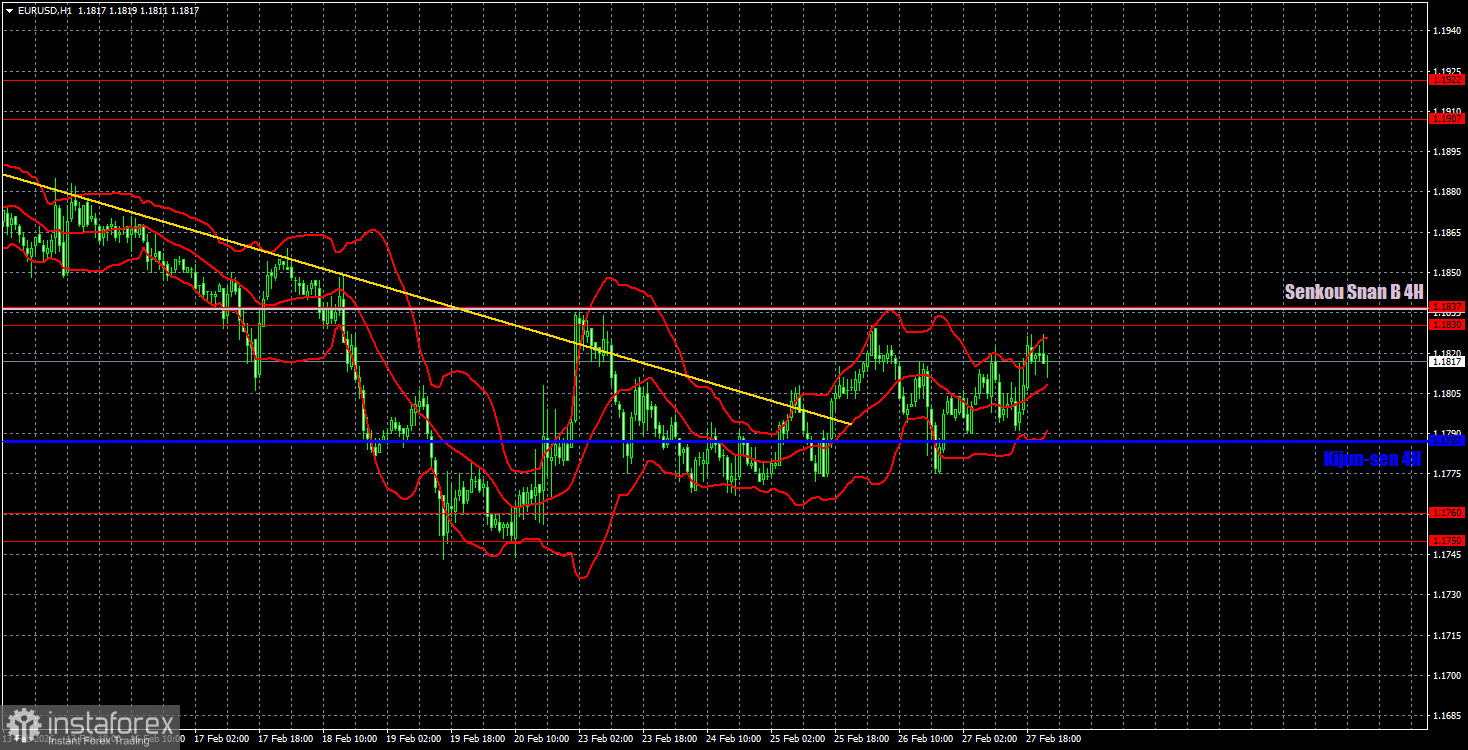
On the hourly timeframe, the EUR/USD pair has growth potential, but it requires consolidation above the Senkou Span B line. The pair left the sideways channel of 1.1400-1.1830 at the beginning of the year, where it spent seven months, so the global upward trend has officially resumed. However, in the last two weeks, we have seen another surprising rise in the US dollar. Now, the trend needs to shift upward on the hourly timeframe.
For March 2, we highlight the following trading levels: 1.1362, 1.1426, 1.1542, 1.1604-1.1615, 1.1657-1.1666, 1.1750-1.1760, 1.1830-1.1837, 1.1907-1.1922, 1.1971-1.1988, 1.2051, 1.2095, as well as the Senkou Span B line (1.1835) and Kijun-sen line (1.1787). The Ichimoku indicator lines may move throughout the day, which should be taken into account when determining trading signals. Don't forget to set stop-loss orders to break even if the price moves 15 pips in the right direction. This will protect against potential losses if the signal turns out to be false.
On Monday, the EU and Germany will publish second estimates of business activity indices in the manufacturing sector, retail sales, and Lagarde will give a speech. In the US, the most important event of the day will be the ISM manufacturing index. However, we should also remind that today the market might react to geopolitical events in the Middle East, so volatility could be high.
On Monday, traders may consider selling with a target of 1.1750-1.1760 in the event of another bounce from the 1.1830-1.1837 area. Long positions could be considered with a target of 1.1907-1.1922 if the Senkou Span B line and the 1.1830-1.1837 area are overcome.
Price support and resistance levels are indicated by thick red lines where the movement may end. They do not serve as sources of trading signals.
The Kijun-sen and Senkou Span B lines are Ichimoku indicator lines that are transferred from the 4-hour timeframe to the hourly timeframe. They are strong lines.
Extreme levels are indicated by thin red lines from which the price has previously bounced. They are sources of trading signals.
Yellow lines indicate trend lines, trend channels, and other technical patterns.
Indicator 1 on the COT charts shows the size of the net position of each category of traders.
InstaForex analytical reviews will make you fully aware of market trends! Being an InstaForex client, you are provided with a large number of free services for efficient trading.


