 Stay
Stay 
Trading Conditions
Products
Tools


The GBP/USD currency pair plummeted on Monday, and the British pound continues its losing streak. Recall that just a month ago, the British pound, together with the euro, could have resumed its upward trend after a slight correction. However, the Bank of England made a borderline, more "dovish" decision at its January meeting, followed by disappointing British GDP figures, a 0.4% year-on-year drop in inflation in January, and an increase in the unemployment rate to 5.2%. Market expectations for the next BoE meeting have turned 100% dovish.
In addition, the US labor market has started to show signs of recovery, with the unemployment rate in America decreasing for two consecutive months, while traders have simply ignored all the negative reports from across the ocean. The "cherry on top" was the full-scale war in the Middle East, which significantly increased demand for safe-haven assets, of which the dollar remains a contender.
On Monday, the ISM Manufacturing Index was published in the US. The index for February came in higher than forecasts, but the market paid no attention to this important report. In the afternoon, the British pound was recovering quite actively, though it did not significantly improve its situation. It appears more like a pullback before a new collapse. Unfortunately, it is difficult to say how long the market will react to the war in Iran, so the market will remain in a state of turmoil for the foreseeable future. Let's also note that the US will see several important macroeconomic reports this week.
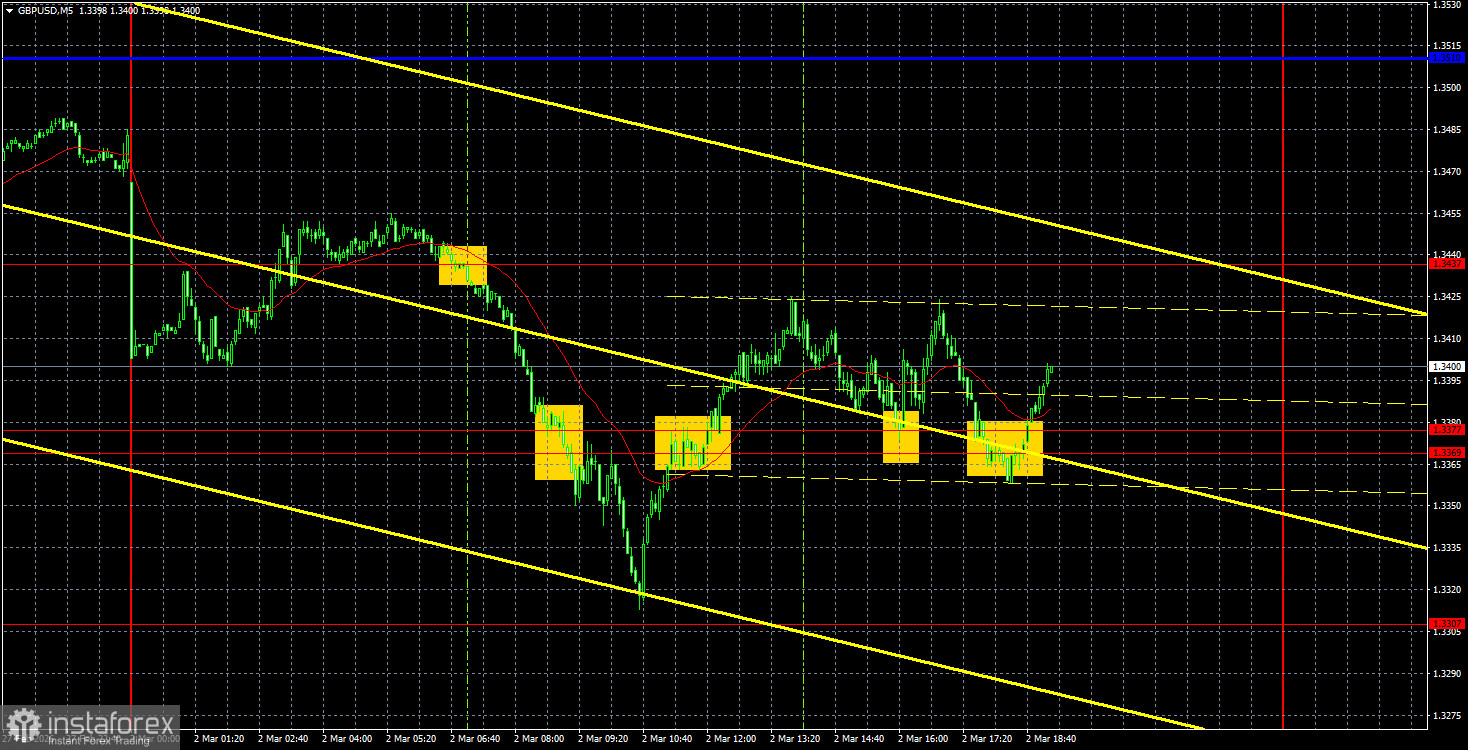
On the 5-minute timeframe, several signals were formed on Monday. The day started with a consolidation below 1.3437, allowing traders to open short positions. The nearest buy signal near the area of 1.3369-1.3377 prompted traders to close their shorts and open longs. Consequently, the price bounced off the mentioned area twice, allowing traders to open new longs each time. There shouldn't have been any losing trades throughout the day, but the movements on the 5-minute timeframe clearly showed how chaotic the price action was.
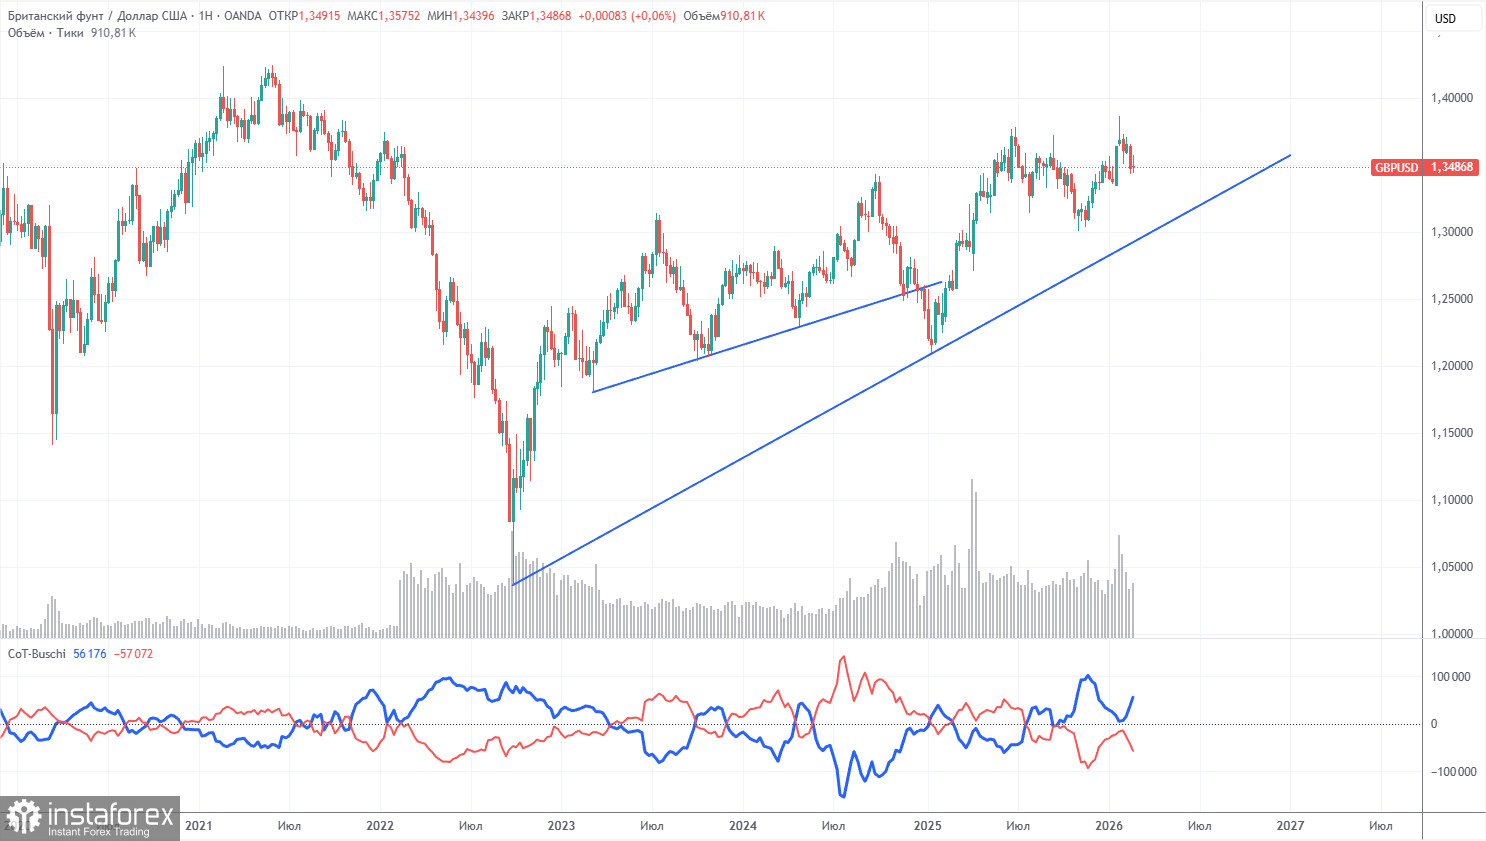
COT reports for the British pound show that the sentiment of commercial traders has been changing constantly in recent years. The red and blue lines representing the net positions of commercial and non-commercial traders frequently intersect and are mostly close to the zero mark. Currently, the lines are approaching each other, with non-commercial traders still dominating with... sales. Recently, speculators have actively increased their long positions, but they have not yet managed to move into a zone of superiority.
The dollar continues to decline due to Donald Trump's policies, which is clearly visible on the weekly timeframe (illustration above). The trade war will continue in one form or another for a long time, and the Fed will, in any case, be lowering rates in the next 12 months. Demand for the dollar will fall in any case. According to the latest COT report (dated February 24) for the British pound, the "Non-commercial" group closed 14,800 BUY contracts and 100 SELL contracts. Thus, the net position of non-commercial traders decreased by another 14,700 contracts over the week.
In 2025, the pound rose quite significantly, but it should be noted that there is one reason for this: Trump's policies. Once this reason is mitigated, the dollar could begin to rise. But when this will happen is unknown to anyone.
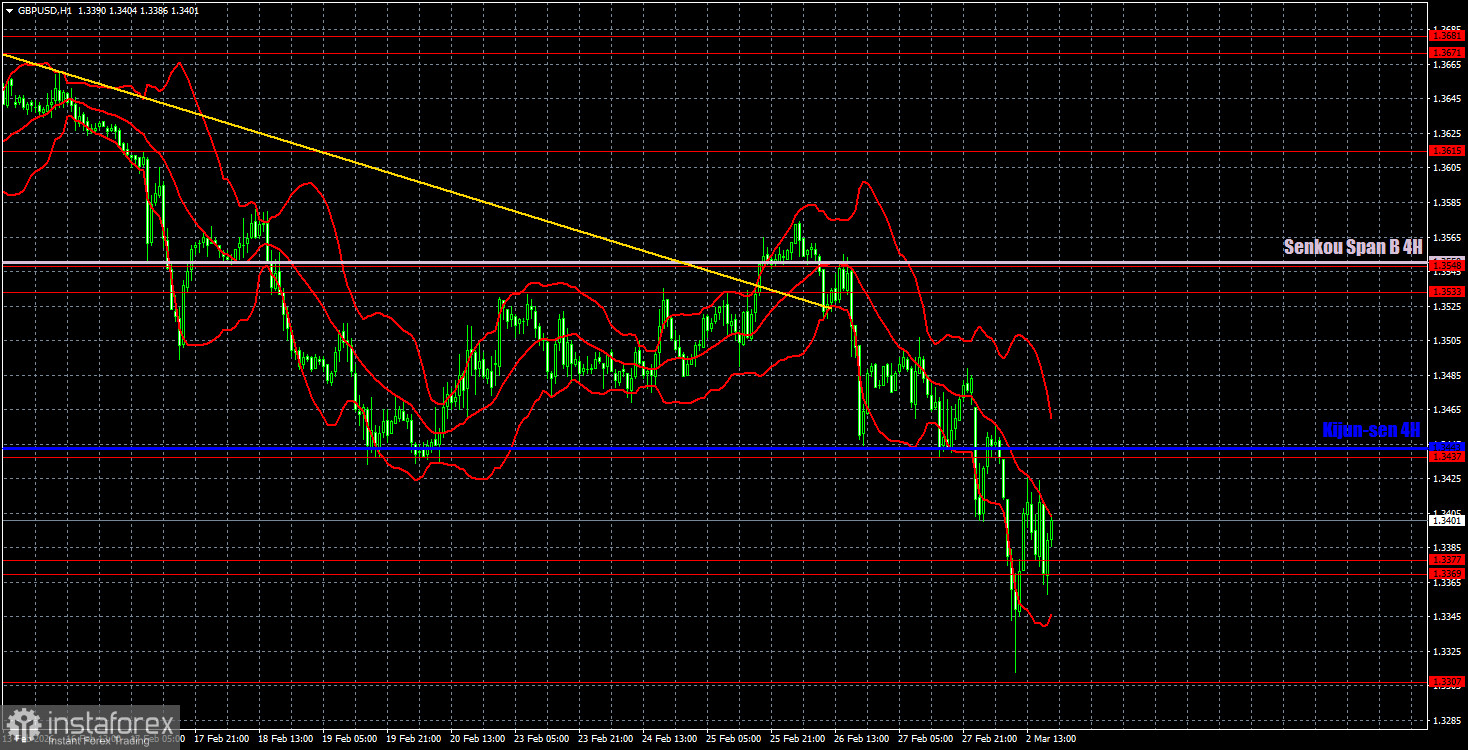
On the hourly timeframe, the GBP/USD pair could be poised to form an upward trend; however, geopolitical factors are weighing on the British pound. Despite the significant decline of the pair in February, we still view this as a correction. The daily timeframe confidently signals the preservation of the upward trend.
For March 3, we highlight the following important levels: 1.3201-1.3212, 1.3307, 1.3369-1.3377, 1.3437, 1.3533-1.3548, 1.3615, 1.3671-1.3681, 1.3751-1.3763, 1.3846-1.3886, and 1.3948. The Senkou Span B line (1.3550) and Kijun-sen line (1.3443) may also act as sources of signals. It is recommended to set the Stop Loss order to break even if the price moves 20 pips in the correct direction. The lines of the Ichimoku indicator may shift during the day, which should be taken into account when determining trading signals.
On Tuesday, there are no significant events scheduled in the UK or the US, but market volatility may persist throughout the day. Now, everything will depend on how events unfold in the Middle East.
Today, traders may open new short positions with targets at 1.3369-1.3377 and 1.3307 if the pair bounces off the Kijun-sen line. Long positions will become relevant with targets of 1.3533-1.3548 if the price surpasses the critical line and the 1.3437 level.
InstaForex analytical reviews will make you fully aware of market trends! Being an InstaForex client, you are provided with a large number of free services for efficient trading.


