 Stay
Stay 
Trading Conditions
Products
Tools


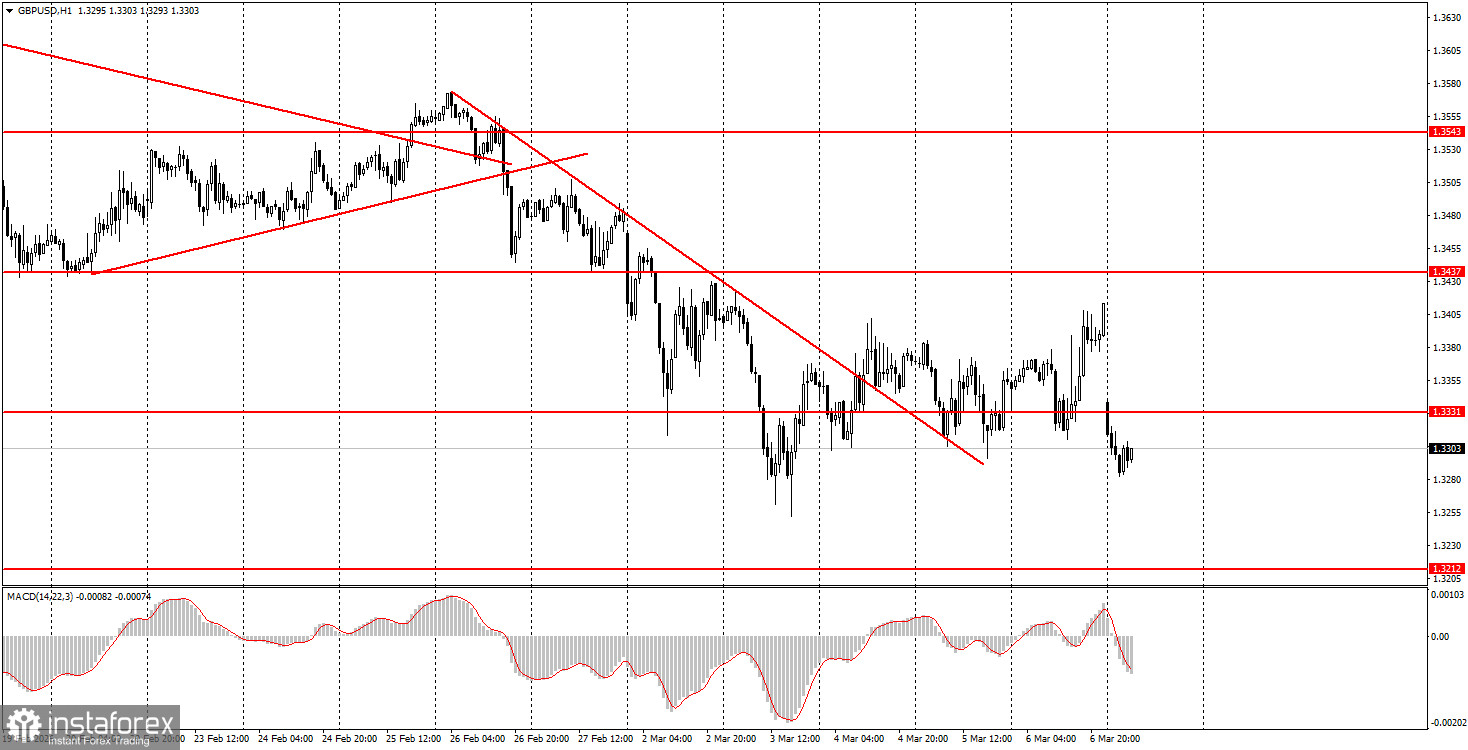
The GBP/USD pair finally began to move upward on Friday, breaking through another descending trend line. As we can see, this movement had no lasting impact on Monday. Over the weekend, it was reported that American troops might soon begin a ground operation in Iran, aimed at destroying uranium stockpiles, which caused the GBP/USD pair to fall again on Monday. Thus, despite the absolutely disappointing labor market and unemployment data (and this is far from the only macroeconomic indicator that has failed in the U.S. recently), the dollar still rose amid another breakdown of the downward trend. The market continues to buy the U.S. dollar with every escalation of the war in Iran, given its status as a safe-haven currency. However, we believe the reasoning goes beyond the dollar's status. The market is pulling assets out of Iran and neighboring countries that oppose Iran and moving them into the most understandable currency for them—the dollar.
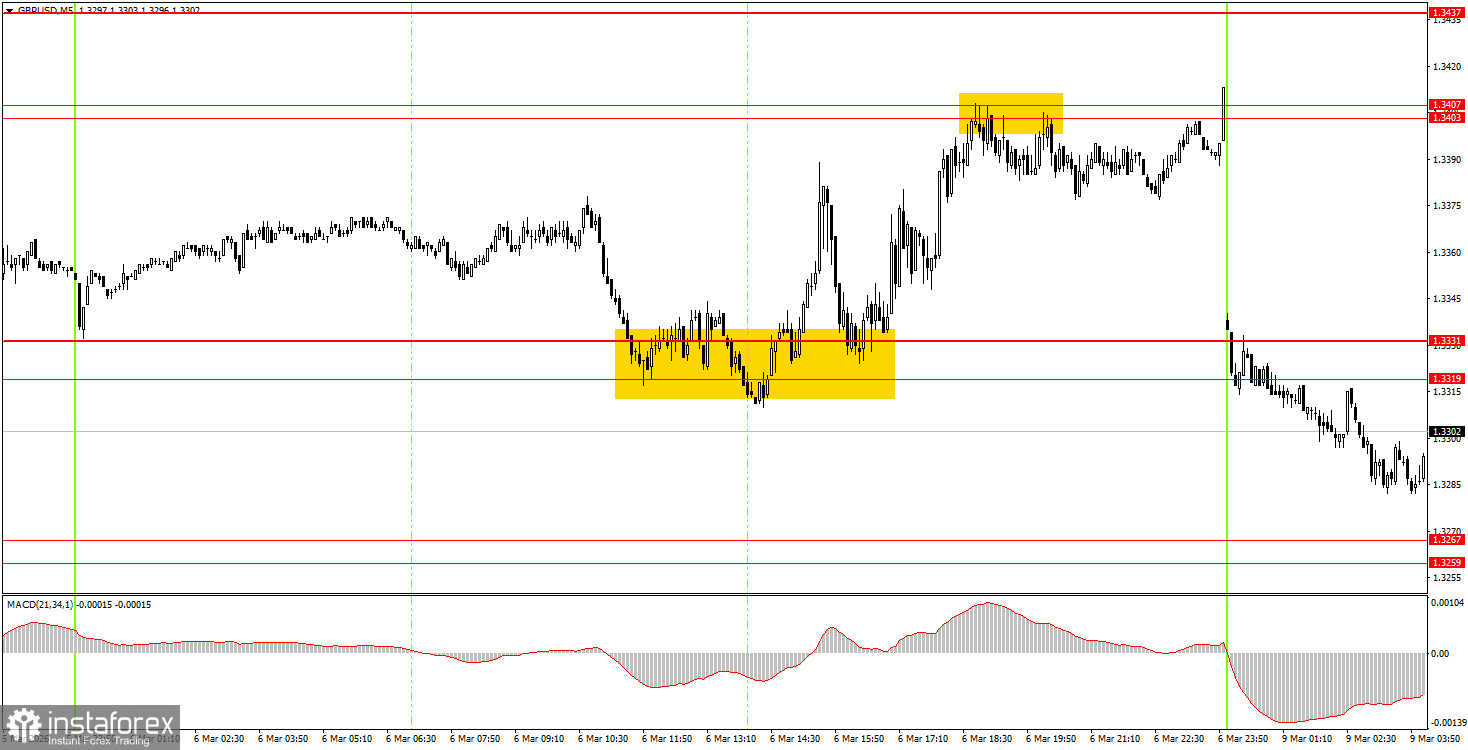
On the 5-minute timeframe on Friday, beginner traders could work with only one trading signal. The price bounced twice during the American trading session from the area of 1.3319-1.3331, which triggered a rise to the area of 1.3403-1.3407. This movement was partially supported by U.S. data. Long positions were profitable, and no other signals formed on Friday, except for a bounce from 1.3403-1.3407 right before the market closed.
On the hourly timeframe, the GBP/USD pair continues to form a "geopolitical trend." There are no global fundamentals supporting a medium-term rise in the dollar, so we expect the global upward trend from 2025 to continue in 2026, which could bring the pair to at least 1.4000. In recent weeks, the situation has often not favored the British currency, as the market is fully focused on the war in the Middle East, which continues to benefit the U.S. dollar.
On Monday, beginner traders can open long positions if there is a bounce from the area of 1.3259-1.3267 or a consolidation above the range of 1.3319-1.3331. A price consolidation below the area of 1.3259-1.3267 or a bounce from 1.3319-1.3331 will allow for new short positions to be opened.
On the 5-minute timeframe, trading can currently be conducted at 1.3096-1.3107, 1.3203-1.3212, 1.3259-1.3267, 1.3319-1.3331, 1.3403-1.3407, 1.3437-1.3446, 1.3484-1.3489, 1.3529-1.3543, 1.3643-1.3652, 1.3695, and 1.3741-1.3751. On Monday, there are no important events or reports scheduled in the UK or the U.S. However, movements during the day may still be volatile and tumultuous.
Price levels of support and resistance are levels that serve as targets when opening buys or sells. Take Profit levels can be placed around them.
Red lines represent channels or trend lines that show the current trend and indicate the direction in which it is preferable to trade now.
The MACD indicator (14,22,3) – the histogram and the signal line – is a supporting indicator that can also be used as a source of signals.
Important speeches and reports (always included in the news calendar) can significantly affect the movement of the currency pair. Therefore, during their release, trading should be done with utmost caution, or traders should exit the market to avoid sharp price reversals against the previous movement.
Beginning traders in the forex market should remember that not every trade can be profitable. Developing a clear strategy and effective money management are the keys to long-term trading success.
InstaForex analytical reviews will make you fully aware of market trends! Being an InstaForex client, you are provided with a large number of free services for efficient trading.


