 Stay
Stay 
Trading Conditions
Products
Tools


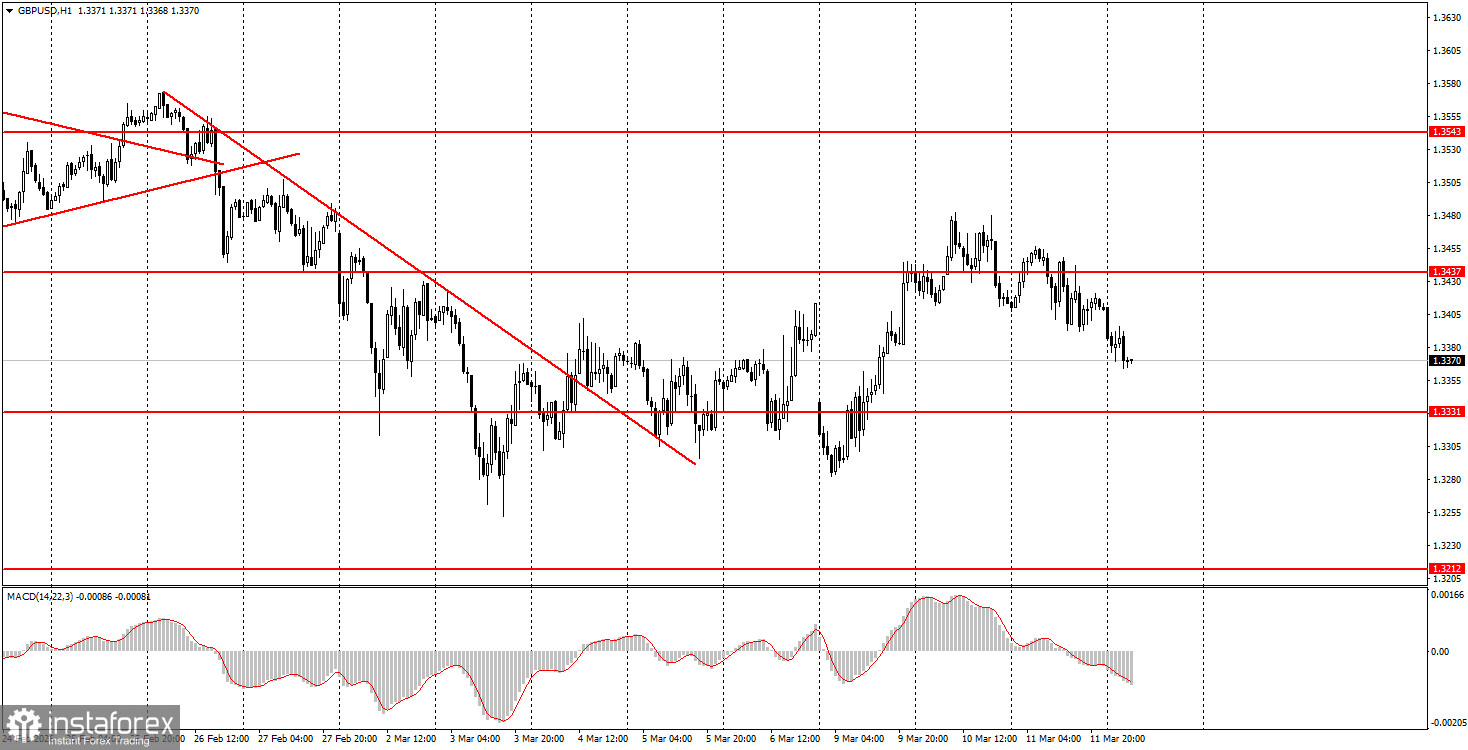
The GBP/USD pair continued its decline on Wednesday, driven solely by geopolitical factors. Unfortunately, every day we are compelled to focus primarily on geopolitics rather than the economy, as economic reports and events have little impact on the dollar or the pound. As mentioned previously, by mid-week, the geopolitical backdrop began to worsen again, and markets realized that there would be no talk of an end to the war in the Middle East anytime soon. Donald Trump may proclaim the war's conclusion, but that does not mean a peace agreement has been reached with Iran, the Strait of Hormuz will be unblocked, or Tehran will stop striking American bases and all U.S. allies in the region. By the way, last night Iran attacked the UAE, hitting not only military or industrial targets with drones. This has led to renewed demand for the safe-haven U.S. dollar amid a lack of positive developments in the Middle East.
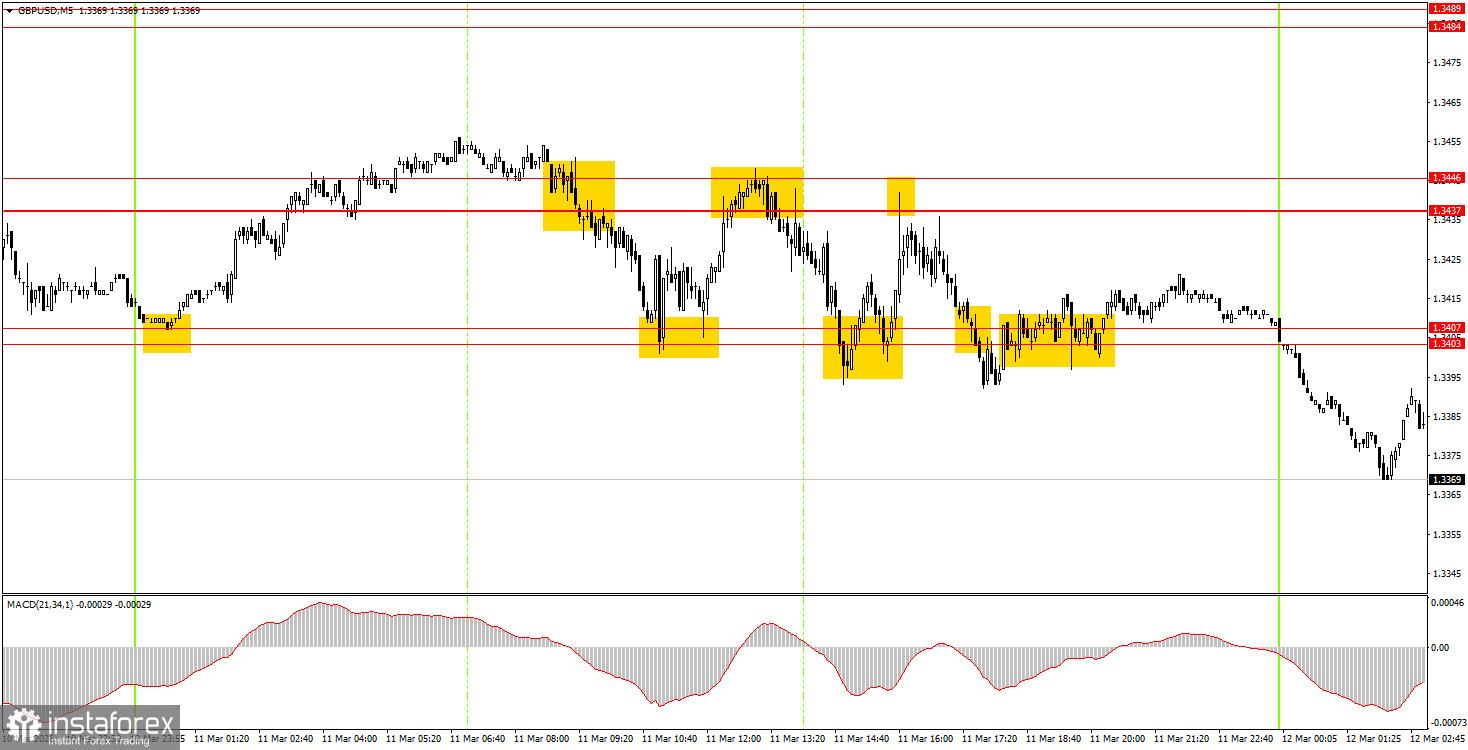
On the 5-minute timeframe, seven trading signals were generated on Wednesday. The price bounced between the 1.3403-1.3407 and 1.3437-1.3446 areas throughout the day. Thus, by trading between these two areas, beginner traders could open at least four profitable trades. The profit from each was modest, but cumulatively they provided a decent profit.
On the hourly timeframe, the GBP/USD pair continues to form a "geopolitical trend." There are no global foundations for medium-term dollar growth, so we expect the global upward trend to continue from 2025, which could take the pair to 1.4000 at a minimum. In recent weeks, the situation has often not favored the British currency, and the market is completely focused on the war in the Middle East, which directly affects the U.S. currency.
On Thursday, beginner traders may consider opening long positions if there is a consolidation above the 1.3403-1.3407 area or a rebound from the 1.3319-1.3331 area. A price consolidation below the 1.3403-1.3407 area will allow for short positions targeting 1.3319-1.3331.
On the 5-minute timeframe, trading can now be done at the levels of 1.3096-1.3107, 1.3203-1.3212, 1.3259-1.3267, 1.3319-1.3331, 1.3403-1.3407, 1.3437-1.3446, 1.3484-1.3489, 1.3529-1.3543, 1.3643-1.3652, 1.3695, and 1.3741-1.3751. On Thursday, Andrew Bailey, the Governor of the Bank of England, is scheduled to speak, and this is the most interesting event of the day, as Bailey rarely speaks and seldom comments on monetary policy and the economy.
Price levels of support and resistance are levels that serve as targets when opening buys or sells. Take Profit levels can be placed around them.
Red lines represent channels or trend lines that show the current trend and indicate the direction in which it is preferable to trade now.
The MACD indicator (14,22,3) – the histogram and the signal line – is a supporting indicator that can also be used as a source of signals.
Important speeches and reports (always included in the news calendar) can significantly affect the movement of the currency pair. Therefore, during their release, trading should be done with utmost caution, or traders should exit the market to avoid sharp price reversals against the previous movement.
Beginning traders in the forex market should remember that not every trade can be profitable. Developing a clear strategy and effective money management are the keys to long-term trading success.
InstaForex analytical reviews will make you fully aware of market trends! Being an InstaForex client, you are provided with a large number of free services for efficient trading.


