 Stay
Stay 
Trading Conditions
Products
Tools


The GBP/USD currency pair also resumed its downward movement on Wednesday, driven by a whole set of formal factors. The decline in the British currency began for technical reasons, following a bounce off the 1.3369-1.3377 area. The decline resumed during the American session because it was the start of the American trading day. The Producer Price Index, indicating accelerating inflation in the US, continued to drive the British pound lower. Additionally, the Fed meeting concluded with a tightening of monetary policy views, which sent the dollar up another 60 pips. Thus, the downward trend persists, and traders are not yet ready to abandon dollar purchases. We will see what happens tomorrow when the results of the Bank of England and the ECB meetings are announced.
Overall, there were no grounds to expect growth in the British currency yesterday or today. The GBP/USD pair failed to overcome the Senkou Span B line and could not break through the trendline. Therefore, the downward trend, which has lasted for a month and a half, continues. The geopolitical factor supporting the dollar remains a key driver of the US currency's strength in spring 2026.
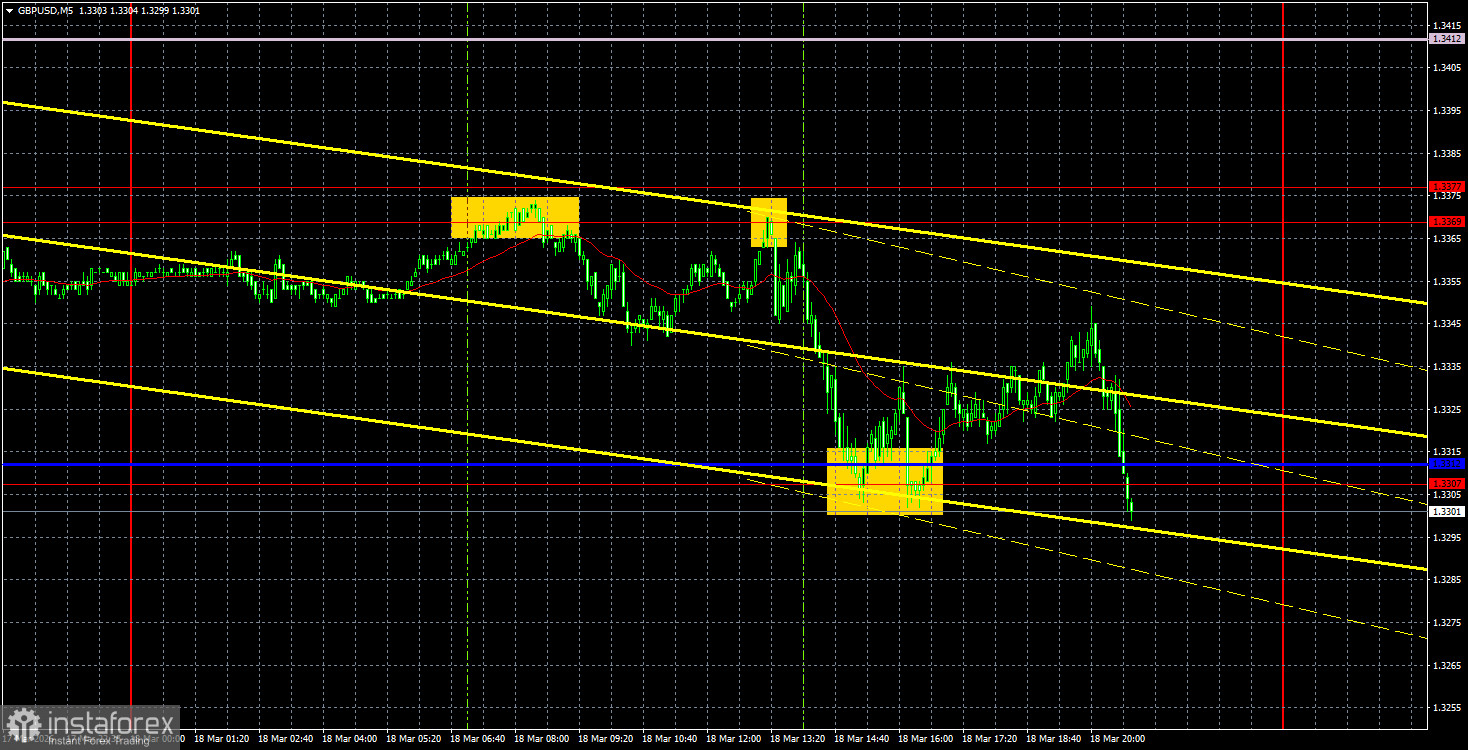
On the 5-minute time frame yesterday, three trading signals were generated. Two bounces occurred from the area of 1.3369-1.3377 and a double bounce from the area of 1.3307-1.3312. All signals could have been exploited, and the sell signals yielded good profits. At the end of the day, after the Fed meeting, another sell signal emerged in the form of a breakout of the area 1.3307-1.3312, but it came after a significant event and was too late. However, traders could have utilized it as well.
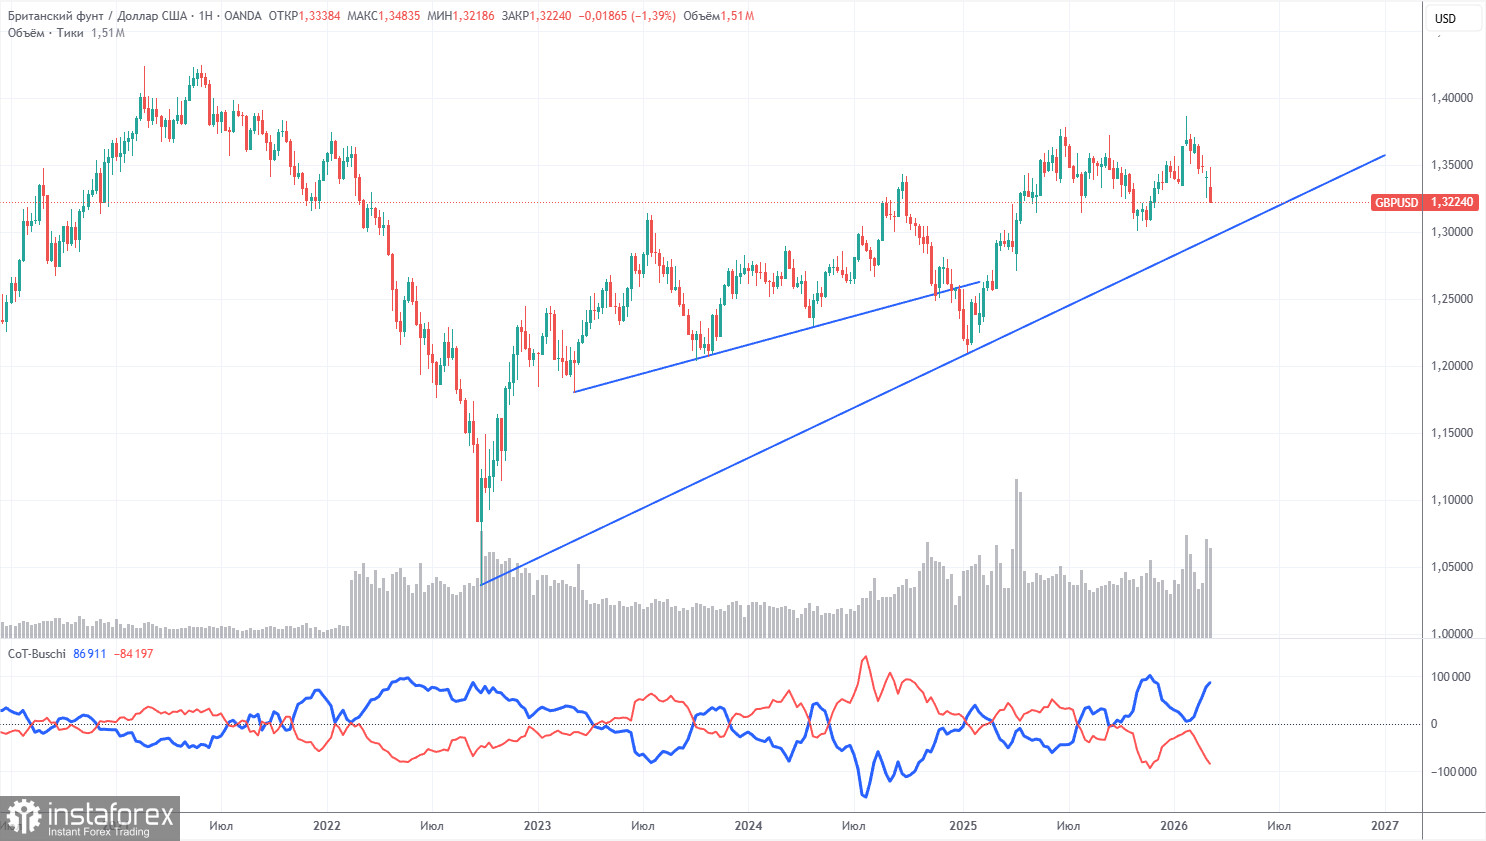
The COT reports for the British pound indicate that commercial traders' sentiment has been changing consistently in recent years. The red and blue lines depicting the net positions of commercial and non-commercial traders frequently intersect and are mostly close to the zero mark. Currently, the lines are distancing from each other, with non-commercial traders still dominating with... selling positions. However, considering the events in the Middle East, it is no longer surprising that demand for riskier currencies is declining while demand for the dollar is increasing.
In the long term, the dollar continues to decline due to Donald Trump's policies, as clearly visible on the weekly time frame (illustration above). The trade war will continue in one form or another for a long time, and the Fed will lower rates in the next 12 months. Demand for the dollar will fall one way or the other. However, geopolitical factors currently take precedence, providing strong support for the US currency. According to the latest COT report (dated March 10) on the British pound, the "Non-commercial" group closed 10,200 BUY contracts and opened 1,200 SELL contracts. Thus, the net position of non-commercial traders decreased by another 11,400 contracts over the week.
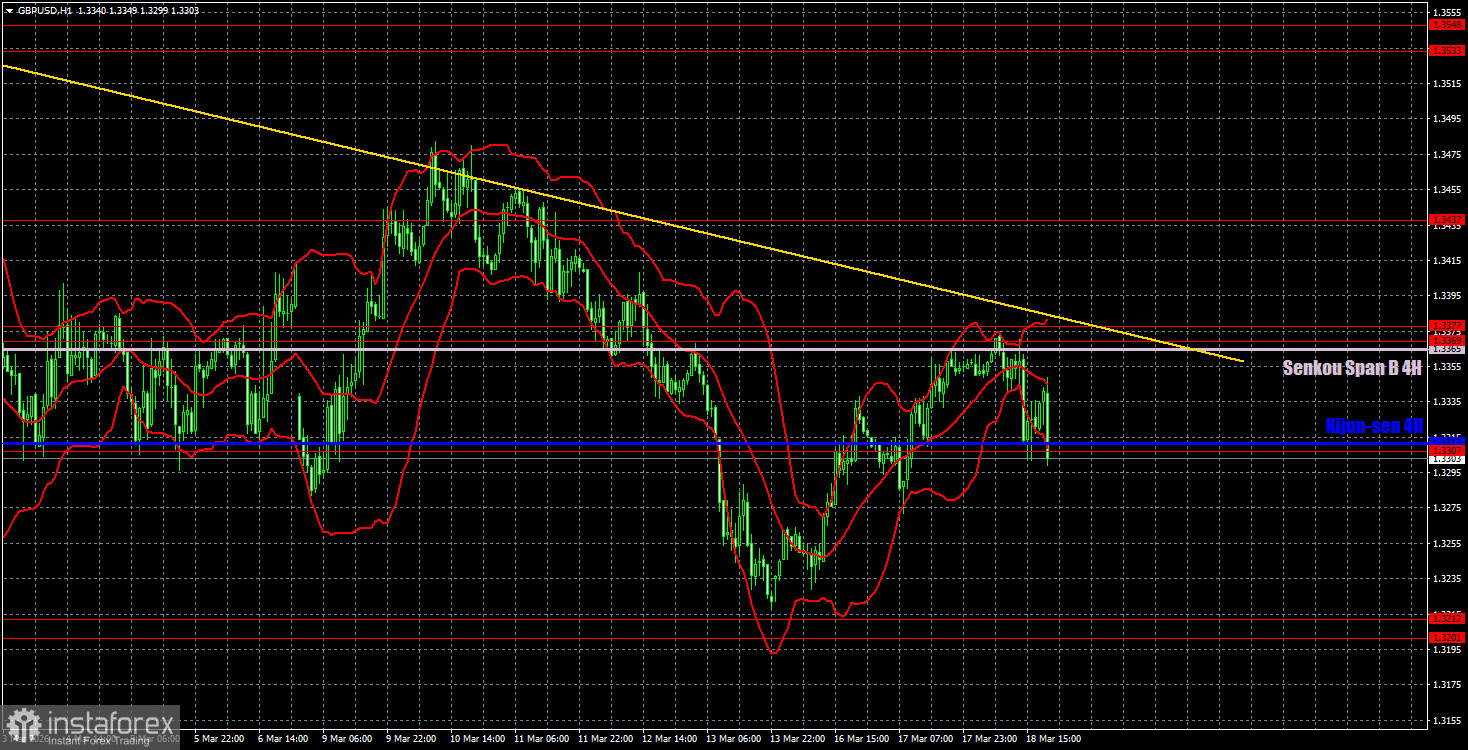
On the hourly time frame, the GBP/USD pair could have long ago transitioned into forming an upward trend, but geopolitics continues to pull the British pound down. Despite the strong decline of the pair in February and March, we still view it as a correction. The daily time frame confidently signals the preservation of the upward trend. Unfortunately, geopolitics is a very unpredictable factor that can overshadow all others, which we are currently witnessing.
For March 19, we highlight the following important levels: 1.3096-1.3115, 1.3201-1.3212, 1.3307, 1.3369-1.3377, 1.3437, 1.3533-1.3548, 1.3615, 1.3671-1.3681, 1.3751-1.3763. The Senkou Span B line (1.3365) and the Kijun-sen line (1.3312) may also serve as sources of signals. It is recommended to set the Stop Loss to break even if the price moves in the correct direction by 20 pips. The lines of the Ichimoku indicator may shift throughout the day, which should be taken into account when determining trading signals.
On Thursday, reports on unemployment and wages are scheduled for release in the UK, as well as the Bank of England meeting. In the US, the calendar is almost empty. Today, we will see how systematically the market reflects the fundamentals, as the Bank of England is likely to adopt a more hawkish stance than at its previous meeting.
Today, traders may remain in short positions targeting 1.3201-1.3207 and below, as the pair has consolidated back below the critical line and bounced from the 1.3369-1.3377 area. Long positions will become relevant with targets at 1.3437 and 1.3533 if the price surpasses the 1.3369-1.3377 area.
InstaForex analytical reviews will make you fully aware of market trends! Being an InstaForex client, you are provided with a large number of free services for efficient trading.


