empty
 
 
You are about to leave
www.instaforex.eu >
a website operated by
INSTANT TRADING EU LTD
Open Account

30.03.202606:58 Forex Analysis & Reviews: Bitcoin (BTC) Trading Recommendations for March 30 According to the ICT System

Relevance up to 00:00 2026-03-31 UTC--4
This information is provided to retail and professional clients as part of marketing communication. It does not contain and should not be construed as containing investment advice or investment recommendation or an offer or solicitation to engage in any transaction or strategy in financial instruments. Past performance is not a guarantee or prediction of future performance. Instant Trading EU Ltd. makes no representation and assumes no liability as to the accuracy or completeness of the information provided, or any loss arising from any investment based on analysis, forecast or other information provided by an employee of the Company or otherwise. Full disclaimer is available here.

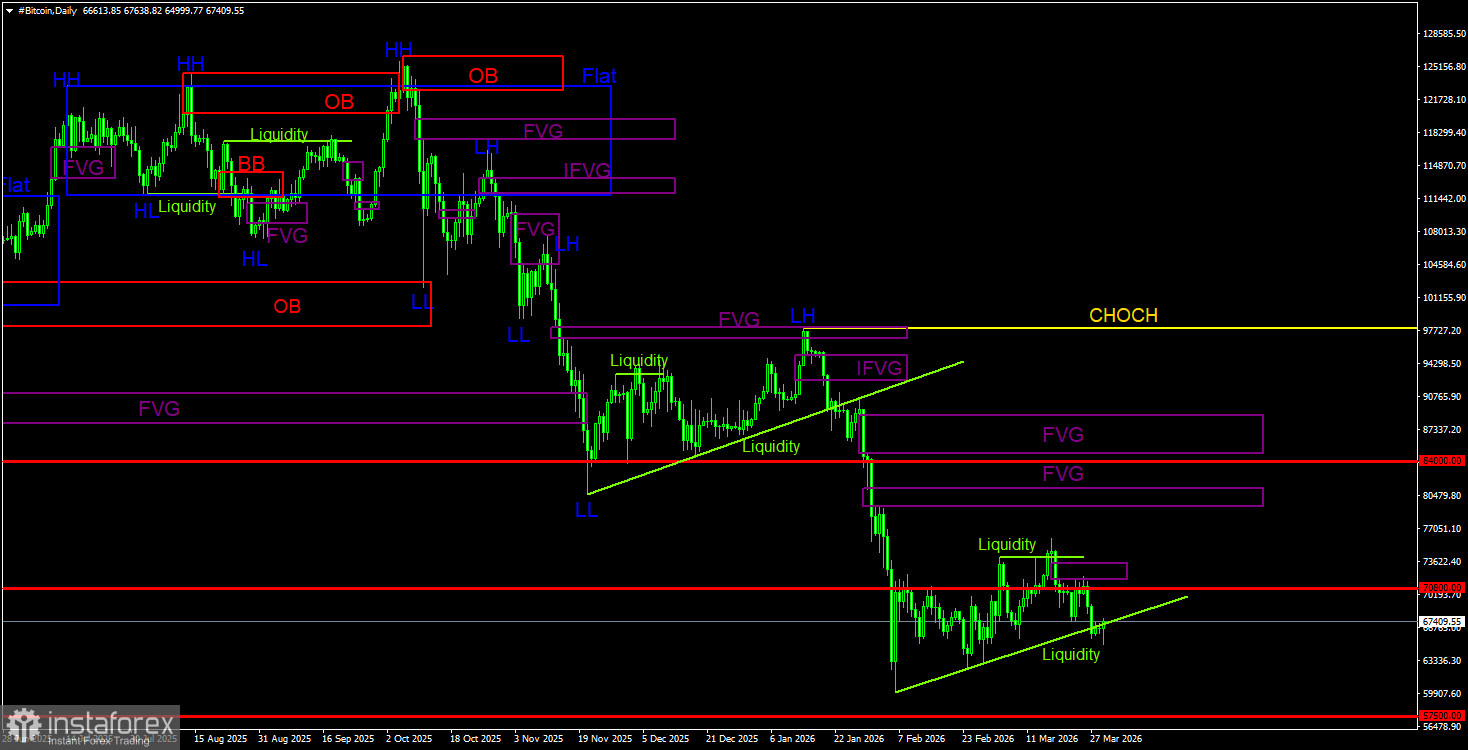
The situation in the cryptocurrency market has remained unchanged for a month and a half. On the daily timeframe, it is still a sluggish, weak upward correction, while on the 4-hour timeframe, it is approximately 80% flat, with a minimal upward inclination. Thus, this is an extremely unattractive time for trading, as there is neither a clear flat nor a clear trend. After Bitcoin exited the sideways channel, we considered the flat canceled because the price action above the channel was too strong. However, deviations can come in various forms. Recent movements in the leading cryptocurrency show that the flat continues. For example, last week the price dropped to the lower boundary of the sideways channel, formed a clear deviation, took liquidity for buying, and is now rising again. Therefore, the internal patterns of the sideways channel are once again of no significance, and the price could soon return to the upper boundary of the channel.

As we have established, Bitcoin has been trading in a flat for a month and a half. This indicates that supply and demand are approximately equal at this time. However, despite the evident flat, many experts continue to discuss Bitcoin accumulation by "whales," increased investments in Bitcoin ETFs, and even the notion that Bitcoin has become a "safe haven" amid the war in Iran. It is worth recalling that Bitcoin has been in a downward trend for the past 6 months. Currently, we see no reason for a new upward trend to begin, and there are no "bullish" patterns on the daily timeframe.

Exchange Rates 30.03.2026 analysis

General Picture of BTC/USD on 1D

On the daily timeframe, Bitcoin continues to form a downward trend. The trend structure is identified as bearish, and the CHOCH line is currently at the level of $97,900. Only above this level can it be considered that the downward trend has ended. The most recent sell signal was formed within the "bearish" FVG ($96,900 – $98,000). Thus, traders had a great opportunity to capture nearly all of the recent downward movement. The current target for the downward trend remains at $57,500, corresponding to the 61.8% Fibonacci retracement level. Given no signs of a trend reversal to the upside, we believe the decline will continue. On the daily timeframe, the nearest area of interest (POI) for new sell trades is in the range of $79,500 – $81,100. Additionally, about a week ago, another bearish FVG formed (with a preliminary withdrawal of selling liquidity), and the price even reacted to it. However, on the 4-hour timeframe, the probability of a sideways trend remains high throughout this period.

Exchange Rates 30.03.2026 analysis

General Picture of BTC/USD on 4H

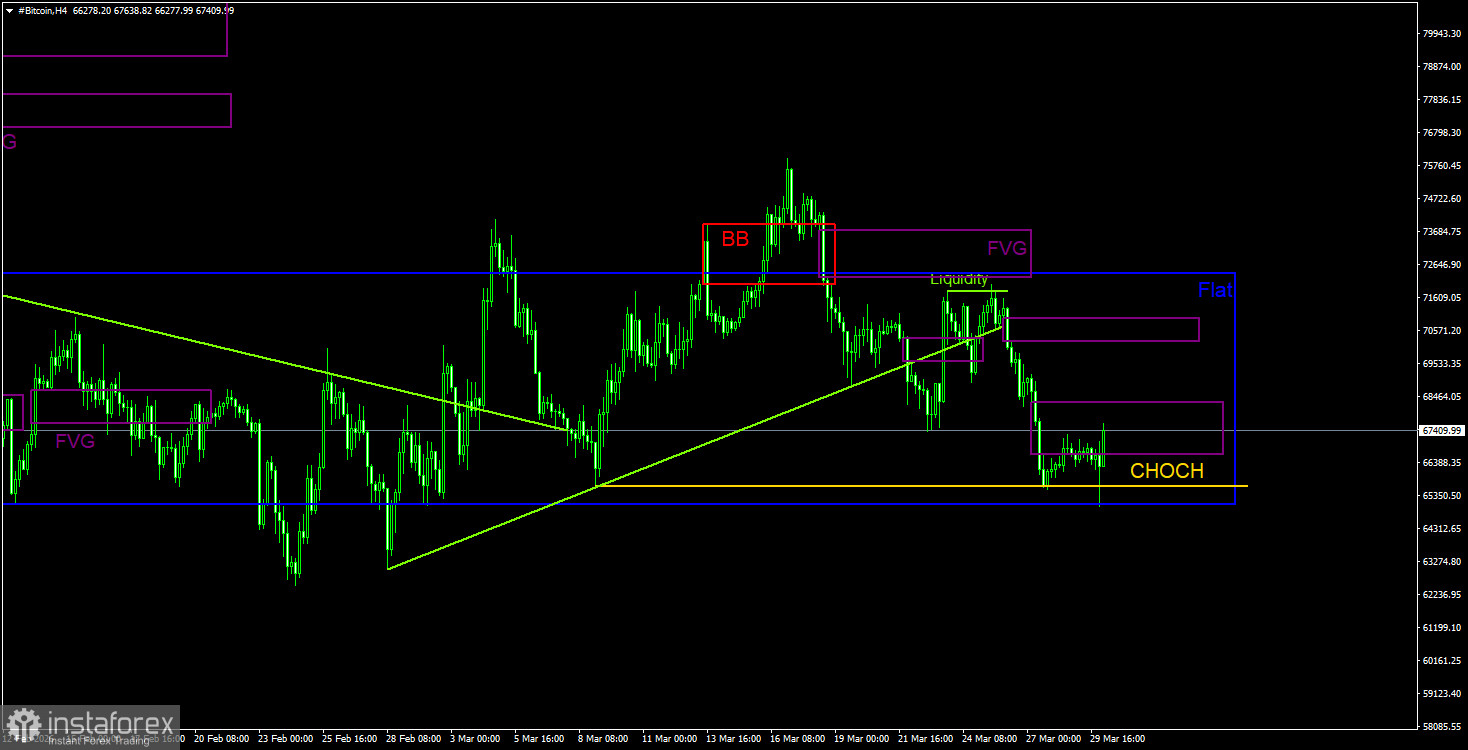
On the 4-hour timeframe, the price has dropped to the lower boundary of the sideways channel, formed a deviation/bounce from it, and may now rise again. The CHOCH line, which provides support for the upward correction, is at $65,500. Breaking this line will mark the end of a month-and-a-half-long correction. During the latest phase of the decline, two new bearish FVGs were formed, but if the flat continues, the internal patterns hold no significance.

Trading Recommendations for BTC/USD:

Bitcoin continues to form a full-fledged downward trend. We expect a decline with a target of $57,500 (the 61.8% Fibonacci level from the three-year upward trend), and there are currently no signs of a trend reversal. However, even the $57,500 level no longer looks like a final stop. Among the areas of interest (POI), the nearest bearish FVG on the daily timeframe is located quite far from the current price. On the 4-hour timeframe, the movement of Bitcoin again shows all the signs of a flat, and the price has dropped to the lower boundary of the sideways channel. Therefore, both FVGs on the 4-hour timeframe may not trigger any reactions.

Explanations of the Illustrations:

  • CHOCH – Change of Character in the trend structure.
  • Liquidity – Liquidity related to stop-loss orders from traders, which market makers use to build their positions.
  • FVG – Fair Value Gap, an area of price inefficiency. Price moves through such areas very quickly, indicating a complete lack of one side in the market. Subsequently, the price tends to return and react to such areas.
  • IFVG – Inverted Fair Value Gap. After returning to such an area, the price does not receive a reaction and impulsively breaks through, then tests it from the other side.
  • OB – Order Block. The candle on which the market maker opened a position in order to capture liquidity to form their own position in the opposite direction.
Paolo Greco
Analytical expert of InstaForex
© 2007-2026

Open trading account

InstaForex analytical reviews will make you fully aware of market trends! Being an InstaForex client, you are provided with a large number of free services for efficient trading.

Earn on cryptocurrency rate changes with InstaForex
Download MetaTrader 4 and open your first trade


You are now leaving www.instaforex.eu, a website operated by INSTANT TRADING EU LTD
Can't speak right now?
Ask your question in the chat.
Widget callback

Turn "Do Not Track" off