 Stay
Stay 
Trading Conditions
Products
Tools


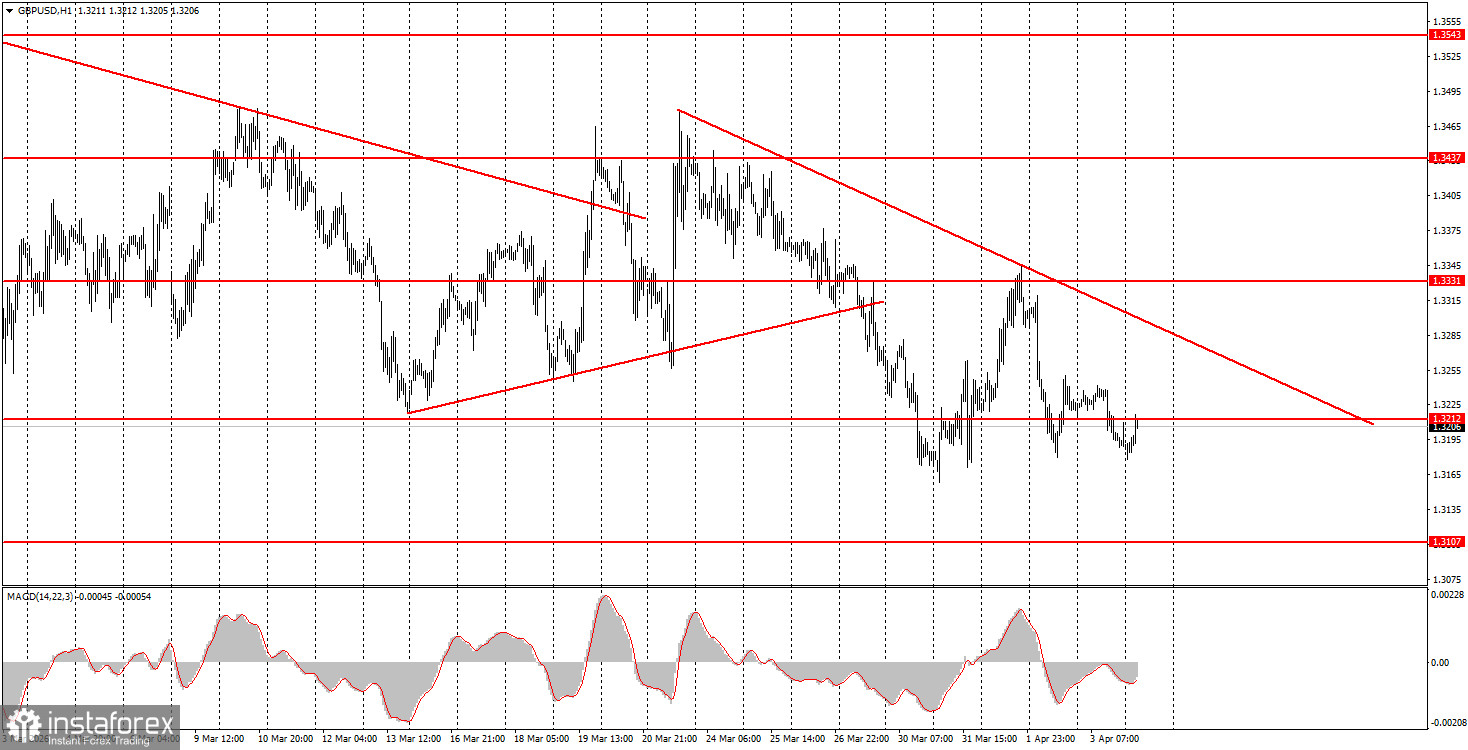
The GBP/USD pair also demonstrated extremely low volatility on Friday, with the market showing absolutely no interest in important data from across the ocean. This can partly be understood. Jerome Powell has already stated twice that the Fed is fully focused on inflation, and the inflation report this week may show an increase of 1% in just one month. As such, the Federal Reserve will rely on the Consumer Price Index in its monetary decisions in the near future. Therefore, the labor market and unemployment data have become less important. However, "less important" does not mean "unimportant." We believe the market continues to ignore nearly all macroeconomic factors amid geopolitical events in the Middle East. A new descending trend line has been established for the British pound, which is just formal. This is because market movements are solely driven by geopolitical news, and recent weeks have shown that these movements are completely random.
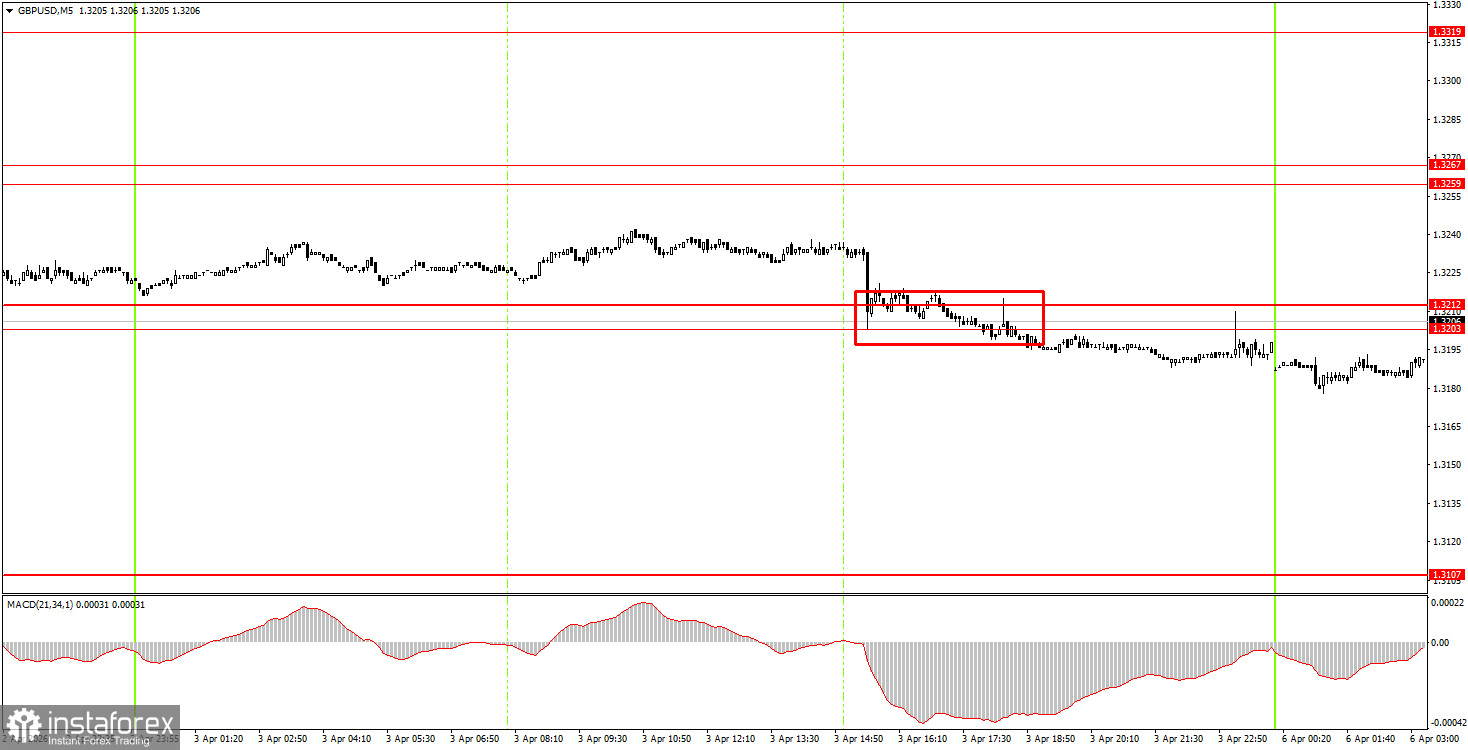
On the 5-minute timeframe, one trading signal was formed on Friday. During the American session, the price consolidated below the 1.3203-1.3212 area, but low volatility prevented traders from making good profits on this signal. The British pound did not move in the desired direction by even 10-15 pips. Thus, the trade yielded neither profits nor losses.
On the hourly timeframe, the GBP/USD pair is forming yet another downward trend. There are no global grounds for medium-term dollar growth, so we expect a resurgence of the global upward trend from 2025 to 2026. However, for this to occur, global geopolitical tensions need to start easing, as the dollar is currently popular solely because of them.
On Monday, beginner traders may consider opening new short positions if the price consolidates below the 1.3203-1.3212 range, targeting 1.3096-1.3107. A consolidation above the 1.3203-1.3212 area will allow for long positions with a target of 1.3259-1.3267.
On the 5-minute timeframe, levels to trade now include: 1.3096-1.3107, 1.3203-1.3212, 1.3259-1.3267, 1.3319-1.3331, 1.3403-1.3407, 1.3437-1.3446, 1.3484-1.3489, 1.3529-1.3543, 1.3643-1.3652, 1.3695, and 1.3741-1.3751. Today, there are no significant events scheduled in the UK, while in the US, the important ISM Services Index will be released, which could easily be ignored by the market, just as the Non-Farm Payrolls and unemployment reports on Friday were.
Price levels of support and resistance are levels that serve as targets when opening buys or sells. Take Profit levels can be placed around them.
Red lines represent channels or trend lines that show the current trend and indicate the direction in which it is preferable to trade now.
The MACD indicator (14,22,3) – the histogram and the signal line – is a supporting indicator that can also be used as a source of signals.
Important speeches and reports (always included in the news calendar) can significantly affect the movement of the currency pair. Therefore, during their release, trading should be done with utmost caution, or traders should exit the market to avoid sharp price reversals against the previous movement.
Beginning traders in the forex market should remember that not every trade can be profitable. Developing a clear strategy and effective money management are the keys to long-term trading success.
InstaForex analytical reviews will make you fully aware of market trends! Being an InstaForex client, you are provided with a large number of free services for efficient trading.


