 Stay
Stay 
Trading Conditions
Products
Tools


The GBP/USD pair continued its upward movement on Friday, driven by market optimism. Negotiations between Tehran and Washington on resolving the conflict in the Middle East were scheduled for Saturday. As we now know, the talks failed, and thus the market's optimism from last week was unfounded. The dollar rose again on Monday night amid increased risks. The Strait of Hormuz will now be blocked not only for foreign (to Iran) vessels but also for Iranian tankers. In simple terms, Washington has decided to block the Strait to Iranian oil exports to prevent Tehran from generating income from them. Thus, a new round of confrontation in the Middle East is beginning. Oil prices have already surged, the dollar is rising, and demand for risky assets will likely decrease again. The macroeconomic and fundamental background this week seems to hold no significance once again.
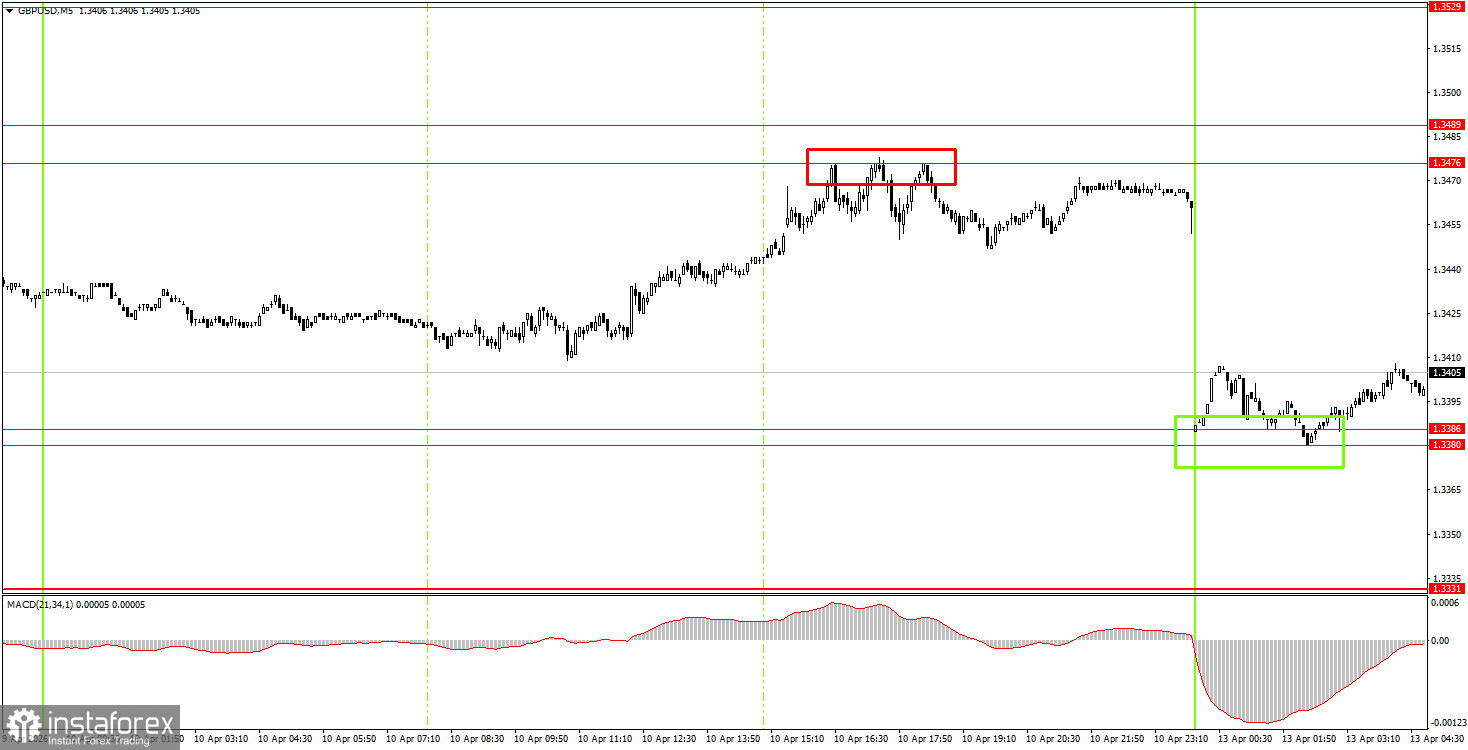
On the 5-minute timeframe, one trading signal was generated on Friday in the form of three rebounds from the level of 1.3476. Traders should note that many levels have been rearranged. The price rebound from the 1.3476 level did not lead to a decline in the pair, and there was no opportunity to react to the events of Saturday and Sunday, as on the opening of trading on Monday night, the pair immediately plummeted by 75 pips. A buy signal was generated at 1.3380-1.3386 overnight.
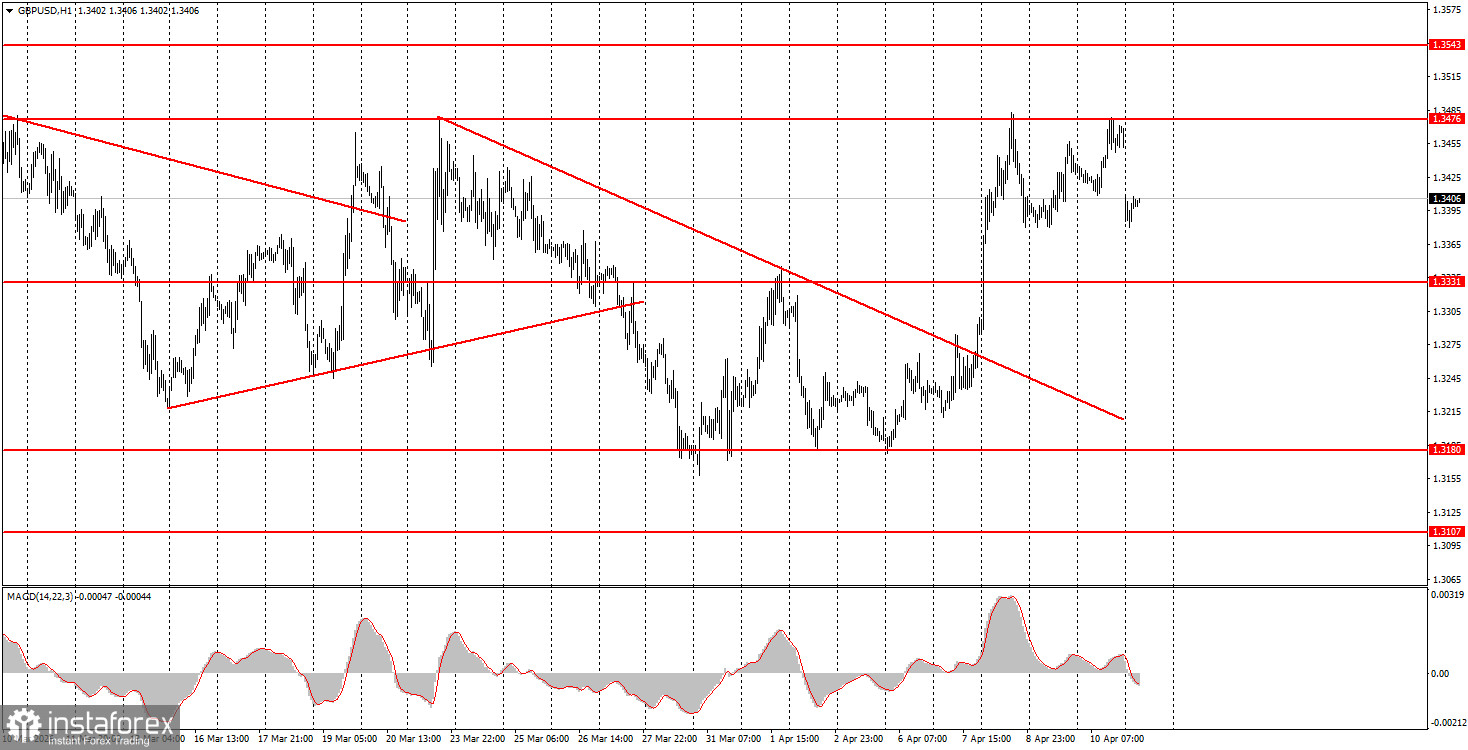
On the hourly timeframe, the GBP/USD pair has begun to form a new upward trend, but the British pound's growth may come to an end as negotiations in Islamabad have failed. There are no global grounds for medium-term growth in the dollar, so we expect the resumption of the global upward trend from 2025 in 2026. However, for this to happen, geopolitical tensions worldwide need to continue to decline, which we are not currently observing.
On Monday, novice traders may open new short positions if the price consolidates below the 1.3380-1.3386 area, targeting 1.3319-1.3331. A rebound from the area of 1.3380-1.3386 will allow for the opening of long positions with a target of 1.3476-1.3489.
On the 5-minute timeframe, trading can currently be conducted at 1.3096-1.3107, 1.3175-1.3180, 1.3259-1.3267, 1.3319-1.3331, 1.3380-1.3386, 1.3476-1.3489, 1.3529-1.3543, 1.3643-1.3652, 1.3695, and 1.3741-1.3751. Today, there are again no significant events planned in the UK, while in the US, only a secondary report on existing home sales will be released. The market has already reacted to the failure of the negotiations in Pakistan, so it is uncertain whether we will see new "price flights" today.
Price levels of support and resistance are levels that serve as targets when opening buys or sells. Take Profit levels can be placed around them.
Red lines represent channels or trend lines that show the current trend and indicate the direction in which it is preferable to trade now.
The MACD indicator (14,22,3) – the histogram and the signal line – is a supporting indicator that can also be used as a source of signals.
Important speeches and reports (always included in the news calendar) can significantly affect the movement of the currency pair. Therefore, during their release, trading should be done with utmost caution, or traders should exit the market to avoid sharp price reversals against the previous movement.
Beginning traders in the forex market should remember that not every trade can be profitable. Developing a clear strategy and effective money management are the keys to long-term trading success.
InstaForex analytical reviews will make you fully aware of market trends! Being an InstaForex client, you are provided with a large number of free services for efficient trading.


