 Stay
Stay 
Trading Conditions
Products
Tools


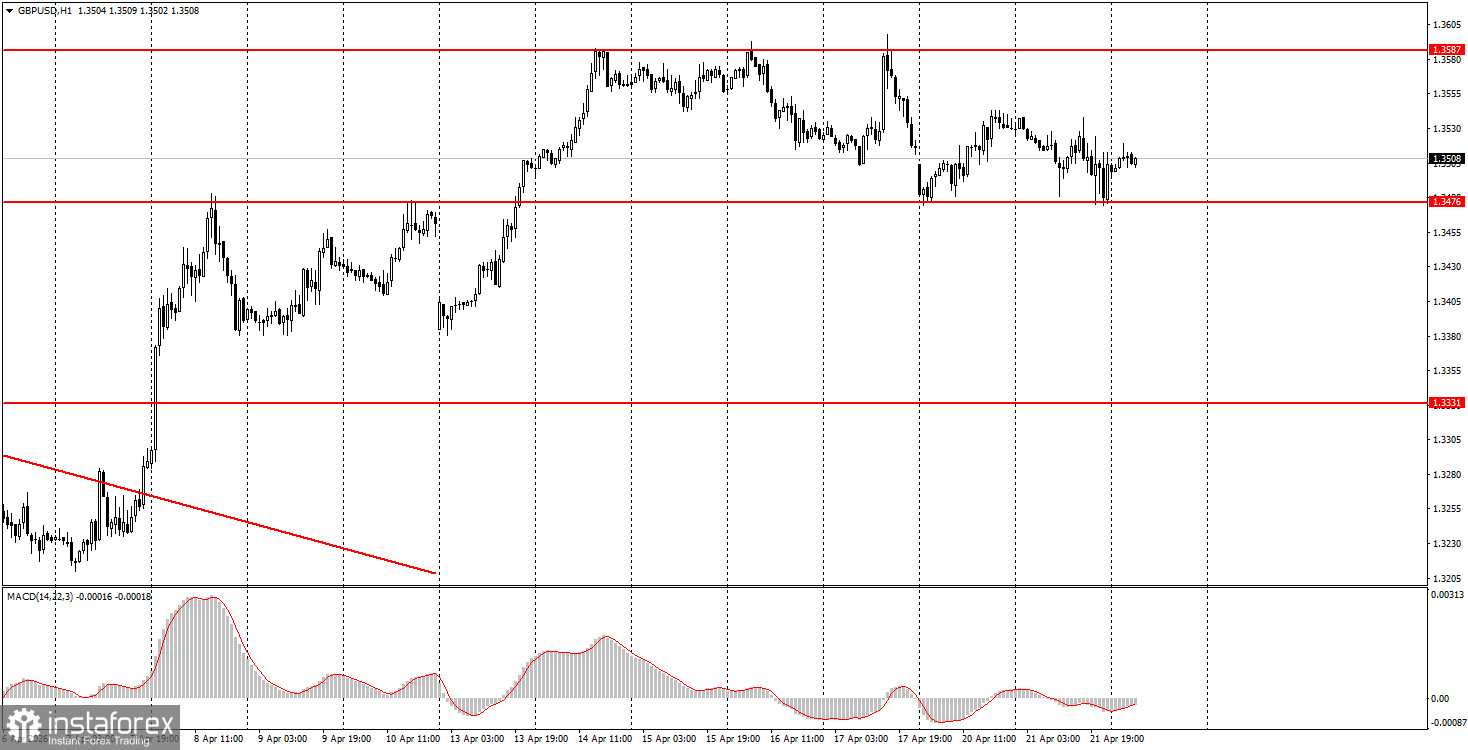
The GBP/USD pair also leaned towards a correction on Tuesday but failed to consolidate below 1.3476. Thus, for six full days, the British currency has traded between 1.3476 and 1.3587, essentially within a range. Yesterday, several interesting reports were published in the UK. For instance, the unemployment rate unexpectedly dropped to 4.9%. However, the market chose to ignore this report, as it did others that were less significant.
As for the geopolitical backdrop, it should now be clearly divided into two categories: rumors, speculation, and insider information, and official statements and events. As of Wednesday, the situation in the Middle East remains unchanged. There are still no negotiations, the Strait of Hormuz remains closed, oil prices are rising again, and Tehran and Washington cannot even agree on a meeting, let alone discuss any mythical deal that Donald Trump keeps talking about.
On the hourly timeframe, the GBP/USD pair continues to form an upward trend but has been within the sideways channel of 1.3475-1.3587 for six days now. There are no global grounds for medium-term dollar growth, so we expect a resumption of the global upward trend of 2025 in 2026. For this to happen, global geopolitical tensions need to continue to decline. In any case, we believe that without a significant escalation in the Middle East, the dollar will no longer be able to sustain the growth it has shown over the past two months. However, individual events may still provoke their strengthening.
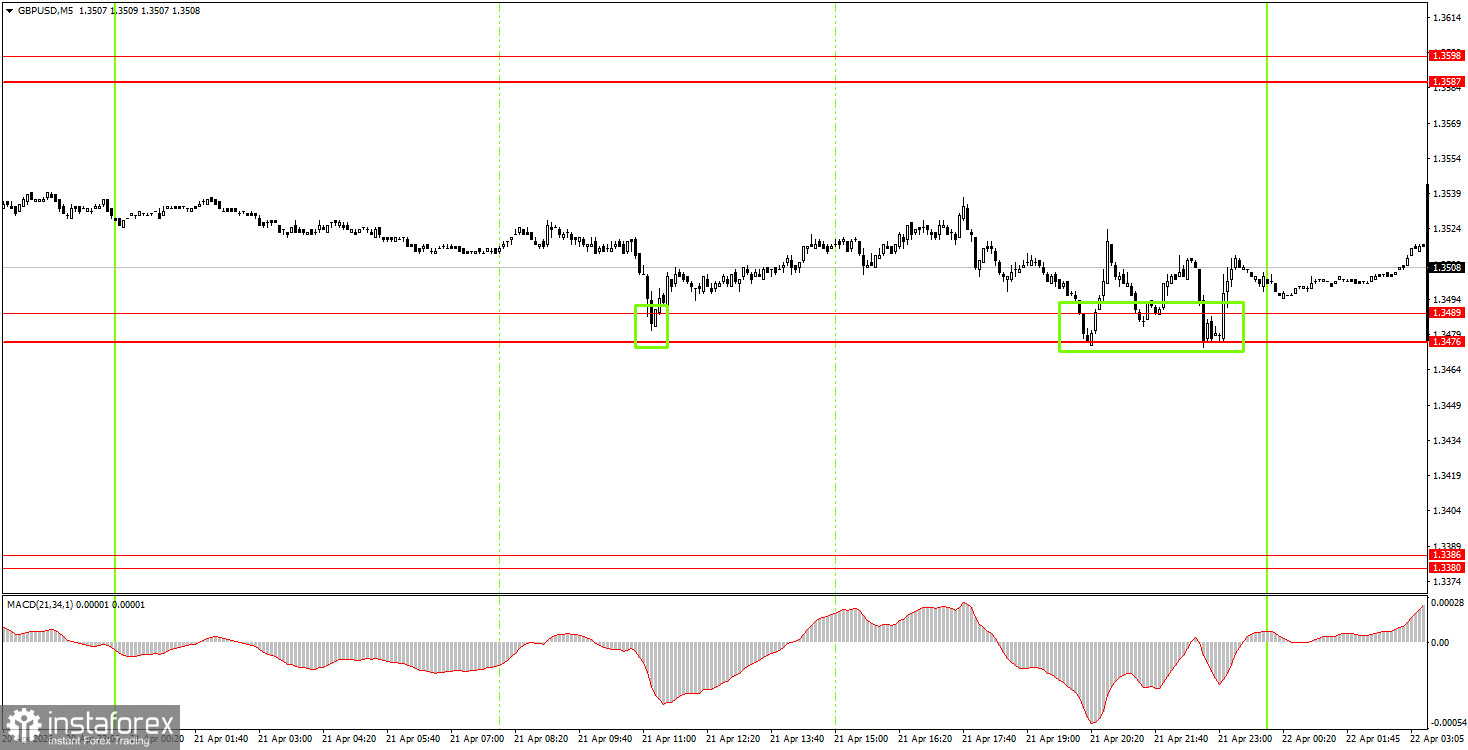
On Wednesday, beginner traders may consider opening short positions if the price settles below the 1.3476-1.3489 area, targeting 1.3380-1.3386. A price bounce from the area of 1.3476-1.3489 will allow for new long positions to be opened, targeting 1.3587-1.3598.
On the 5-minute timeframe, trading levels to consider include 1.3175-1.3180, 1.3259-1.3267, 1.3319-1.3331, 1.3380-1.3386, 1.3476-1.3489, 1.3587-1.3598, 1.3695, and 1.3741-1.3751. Today, the UK will publish an important March inflation report, which may influence the Bank of England's monetary policy decision. In the US, there are no significant events scheduled.
Price levels of support and resistance are levels that serve as targets when opening buys or sells. Take Profit levels can be placed around them.
Red lines represent channels or trend lines that show the current trend and indicate the direction in which it is preferable to trade now.
The MACD indicator (14,22,3) – the histogram and the signal line – is a supporting indicator that can also be used as a source of signals.
Important speeches and reports (always included in the news calendar) can significantly affect the movement of the currency pair. Therefore, during their release, trading should be done with utmost caution, or traders should exit the market to avoid sharp price reversals against the previous movement.
Beginning traders in the forex market should remember that not every trade can be profitable. Developing a clear strategy and effective money management are the keys to long-term trading success.
InstaForex analytical reviews will make you fully aware of market trends! Being an InstaForex client, you are provided with a large number of free services for efficient trading.


