 Stay
Stay 
Trading Conditions
Products
Tools


The EUR/USD currency pair traded with minimal volatility, primarily sideways, on Wednesday. There were no important events throughout the day, and the market continues to await any resolution to the conflict between Iran and the US. It's worth noting that over the past six days, all the media have alternated between reports of upcoming negotiations and cancellations of negotiations initiated by Iran. Donald Trump agreed to extend the ceasefire, but for how long remains unknown. The U.S. president also mentioned that a division of opinions has formed within the Iranian ruling elite, so Tehran will need time to reach a consensus. Thus, the military conflict remains on pause, the Strait of Hormuz remains blocked, and each new day increases the likelihood of no ceasefire in the long term. As a result, the U.S. dollar is rising again, although a technical correction factor is also at play.
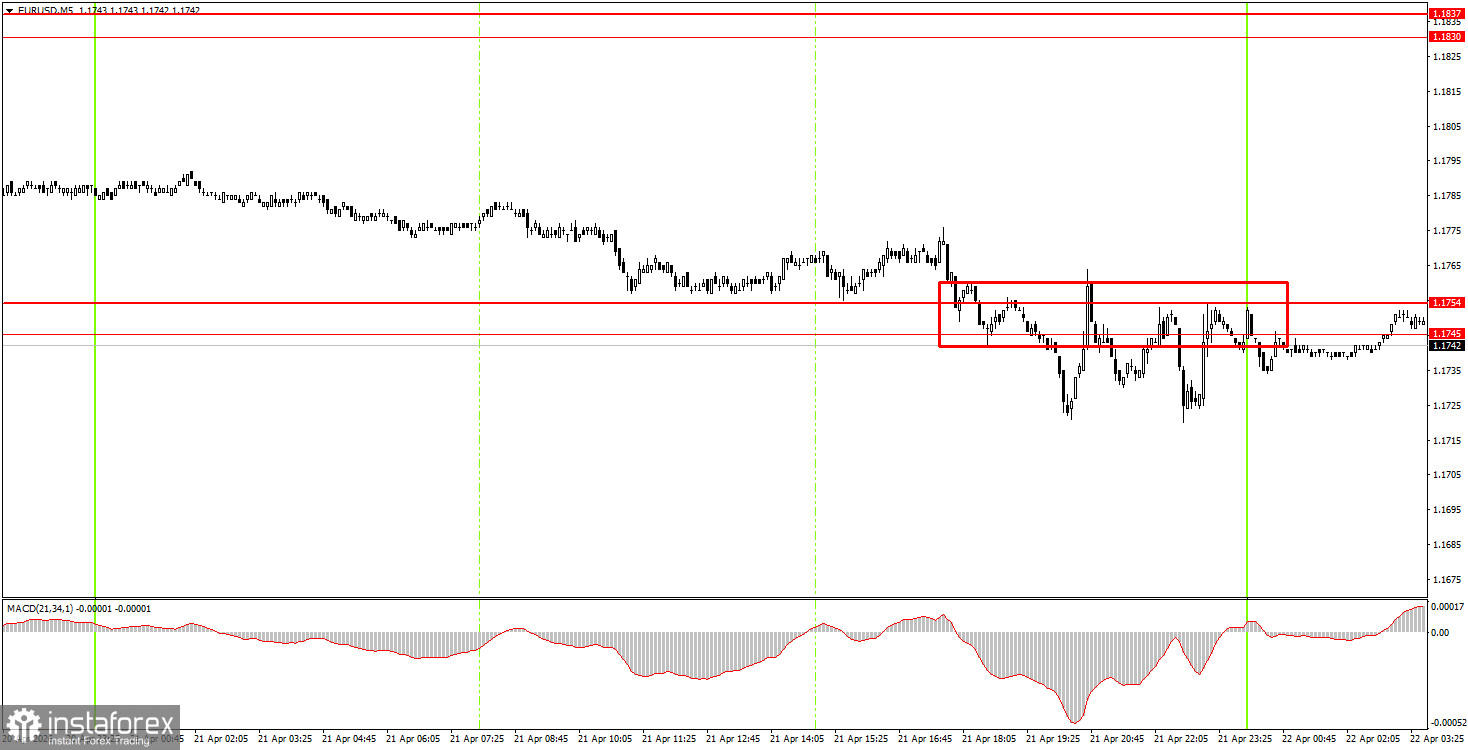
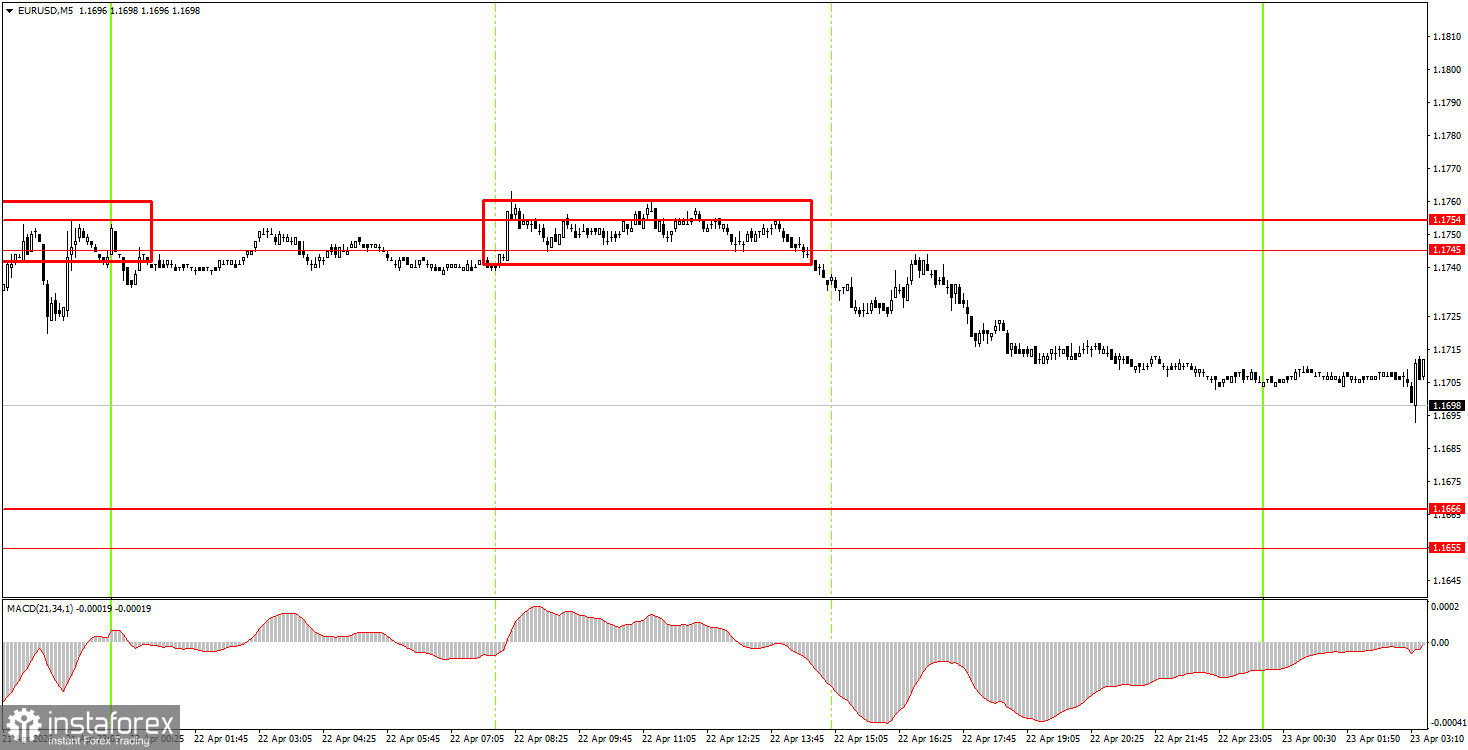
On the 5-minute timeframe, only one trading signal was formed on Wednesday. During the European trading session, the pair bounced off the 1.1745-1.1754 range, allowing beginner traders to open short positions. By the end of the day, these positions could be closed manually for a profit of about 20-25 pips.
On the hourly timeframe, the upward trend remains intact. For two consecutive weeks, the market sold off the dollar, and geopolitics has receded somewhat into the background. However, geopolitical tensions are worsening again, so the U.S. dollar may once more become sought after as a safe asset this week. We believe a correction is possible, but in any case, traders have technical levels to trade from, and movements will depend on developments in the Middle East.
On Thursday, beginner traders can maintain short positions after the price consolidates below the 1.1745-1.1754 area, with a target of 1.1655-1.1666. New buy trades can be considered on a bounce from the area of 1.1655-1.1666 with a target of 1.1745-1.1754.
On the 5-minute timeframe, levels to consider are 1.1354-1.1363, 1.1413, 1.1455-1.1474, 1.1527-1.1531, 1.1584-1.1591, 1.1655-1.1666, 1.1745-1.1754, 1.1830-1.1837, and 1.1899-1.1908. On Thursday, the indices of business activity in the services and manufacturing sectors for April will be published in the EU, Germany, and the US. We believe this data will have only a very weak influence on the pair's movement.
Price levels of support and resistance are levels that serve as targets when opening buys or sells. Take Profit levels can be placed around them.
Red lines represent channels or trend lines that show the current trend and indicate the direction in which it is preferable to trade now.
The MACD indicator (14,22,3) – the histogram and the signal line – is a supporting indicator that can also be used as a source of signals.
Important speeches and reports (always included in the news calendar) can significantly affect the movement of the currency pair. Therefore, during their release, trading should be done with utmost caution, or traders should exit the market to avoid sharp price reversals against the previous movement.
Beginning traders in the forex market should remember that not every trade can be profitable. Developing a clear strategy and effective money management are the keys to long-term trading success.
InstaForex analytical reviews will make you fully aware of market trends! Being an InstaForex client, you are provided with a large number of free services for efficient trading.


