 Stay
Stay 
Trading Conditions
Products
Tools


The GBP/USD currency pair attempted once again to breach the support area of 1.3465-1.3480 on Tuesday but was unsuccessful once more. Thus, the sideways channel of 1.3465-1.3588 remains relevant. Additionally, the British pound is positioned above the Ichimoku indicator lines, suggesting it maintains its upward prospects. Therefore, we would only consider a decline below the 1.3465-1.3480 range. The macroeconomic and fundamental backgrounds in both the UK and the US were absent on Tuesday, so we observed purely technical movements throughout the day, and volatility remained low.
On the hourly timeframe, as mentioned, the upward trend is still intact. There is no trend line at present, but there is no need for one right now. The first half of the week is entirely empty of fundamental and macroeconomic events, with only the significant FOMC meeting taking place this evening. Hence, the first half of the week is technical, while the second half is fundamental.
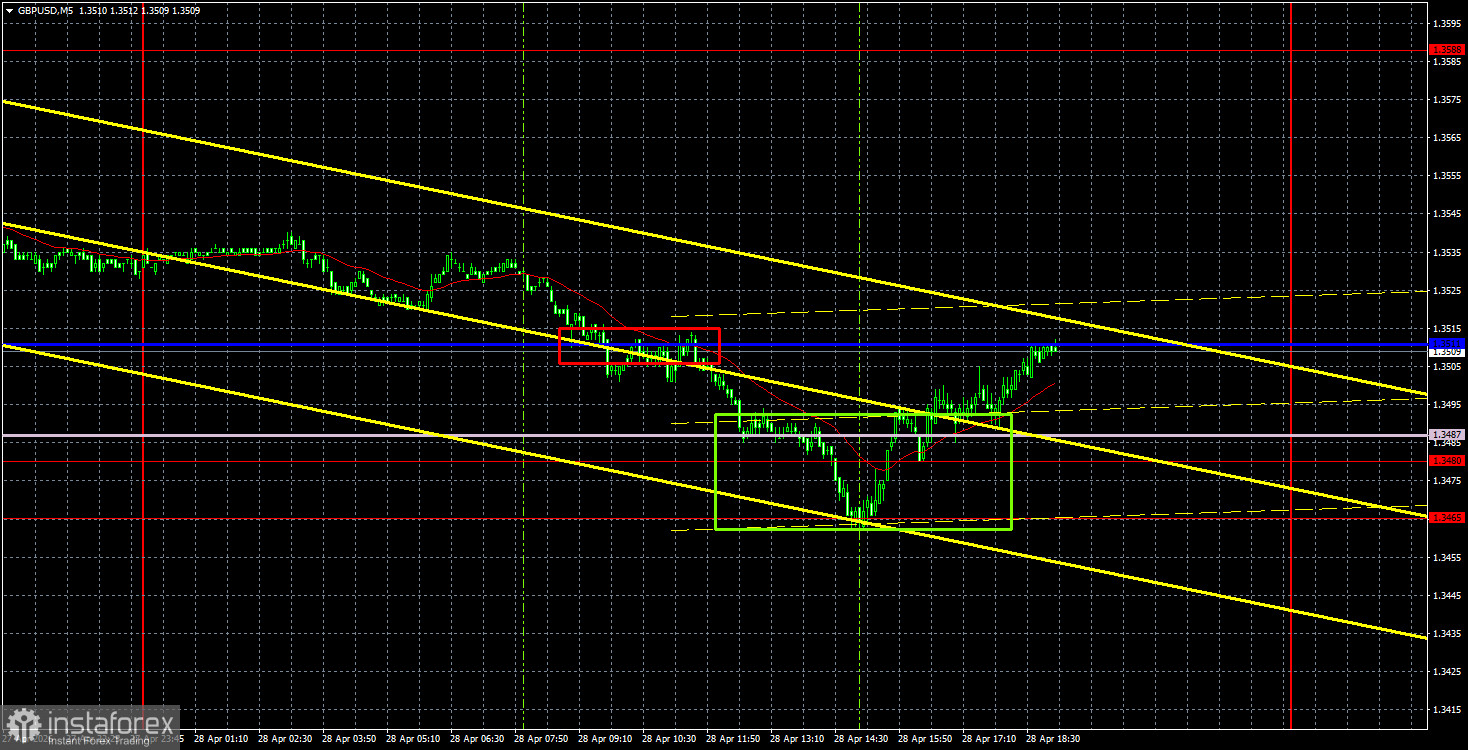
On the 5-minute timeframe, two trading signals were formed on Tuesday. Initially, the pair consolidated below the critical line, then rebounded from the area of 1.3465-1.3480. The first signal was not worth attention, as a strong support area lay just below. However, the second signal could have been executed by traders. It is important to remember that within a range, the Ichimoku indicator lines are less significant, so the boundaries of the sideways channel serve as the primary points of reference. After multiple rebounds from the lower boundary, we should expect a resumption of the upward trend.
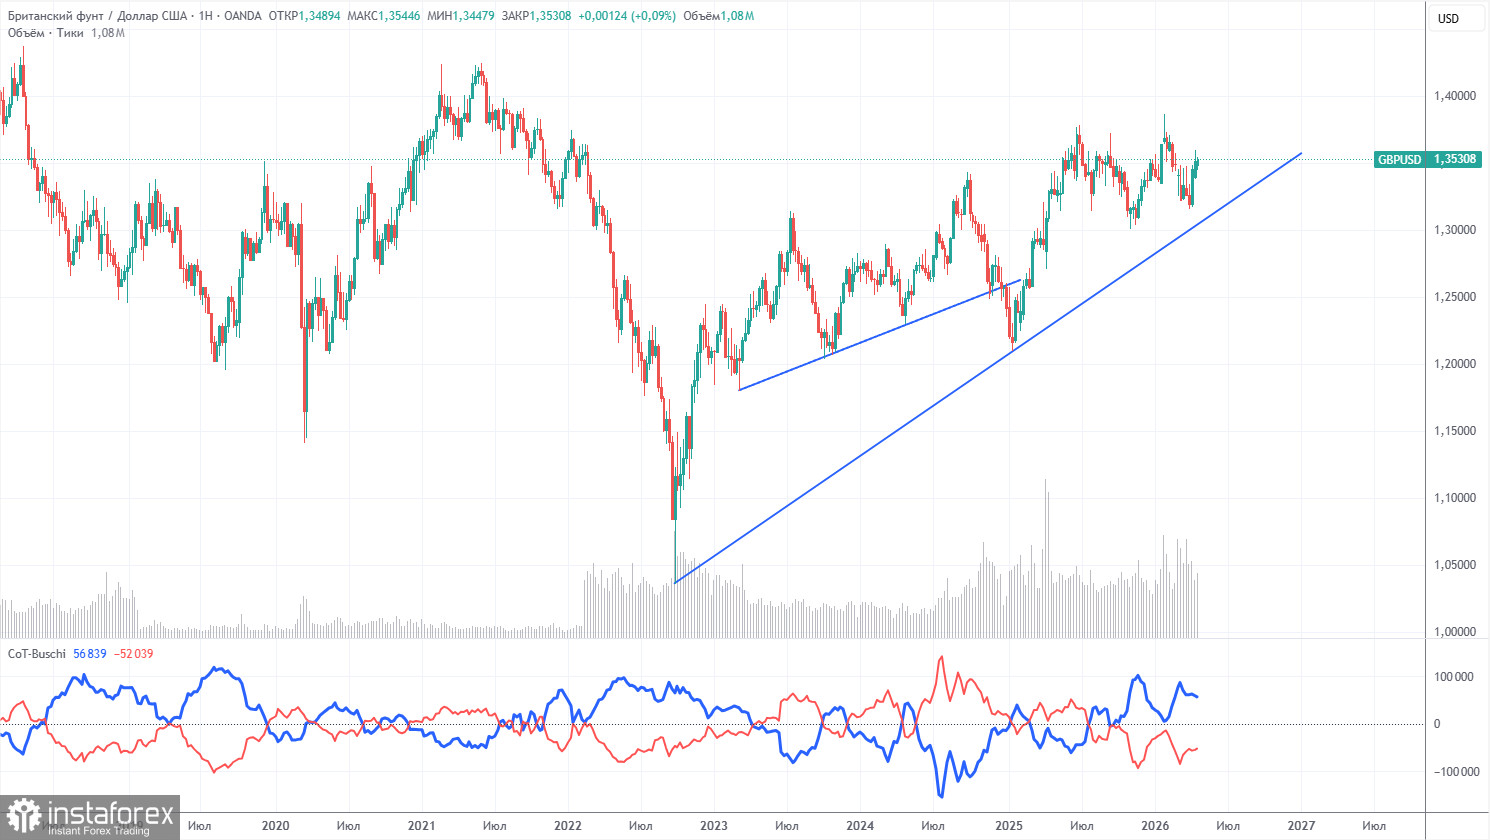
The COT reports for the British pound indicate that commercial traders' sentiment has been changing consistently in recent years. The red and blue lines, representing the net positions of commercial and non-commercial traders, frequently cross each other and are often near the zero mark. Currently, the lines are diverging from each other, with non-commercial traders still dominating with... sales. Given the events in the Middle East, it is no surprise that the demand for risk currencies is declining while demand for the dollar is rising.
In the long term, the dollar continues to weaken due to Donald Trump's policies, which is evident on the weekly timeframe (illustration above). The trade war will persist in one form or another for a long time, and Trump's policies are aimed both directly and indirectly at weakening the U.S. currency. However, geopolitical factors are currently paramount and have recently provided strong support for the dollar. Given the ongoing conflict in the Middle East, the U.S. dollar may still show growth prospects. According to the latest COT report (dated April 21), the "Non-commercial" group opened 8,100 BUY contracts and 5,500 SELL contracts. Thus, the net position of non-commercial traders increased by 2,600 contracts over the week.
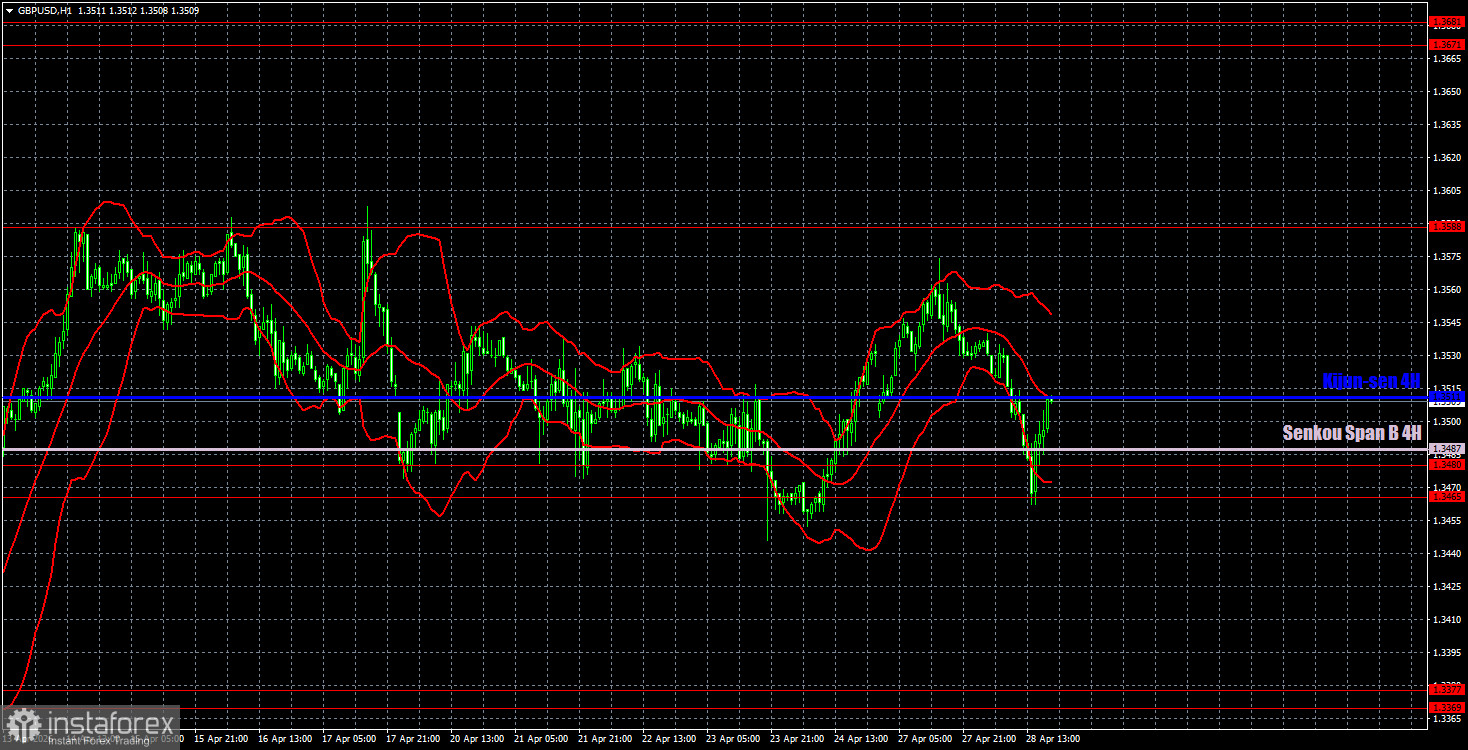
On the hourly timeframe, the GBP/USD pair continues to form an upward trend, which may be reversed if a full-scale war resumes in the Middle East. It should also be noted that the influence of geopolitical factors is weakening, as indicated by movements in recent weeks, although military actions in the region are currently on hold. The Strait of Hormuz remains blocked, with no progress in negotiations, but information suggests that negotiations are still taking place at a distance. This situation supports an upward bias in the British pound.
On April 29, we highlight the following important levels: 1.3096-1.3115, 1.3179-1.3187, 1.3369-1.3377, 1.3465-1.3480, 1.3588, 1.3671-1.3681, 1.3751-1.3763. The Senkou Span B line (1.3487) and Kijun-sen line (1.3511) may also provide signals. It is recommended to set a stop-loss order to breakeven once the price moves in the correct direction by 20 pips. The Ichimoku indicator lines may shift during the day, which should be taken into account when determining trading signals.
On Wednesday, no significant events are scheduled in the UK, while the U.S. will release a report on durable goods orders, which is likely to be ignored, similar to much of the data released in recent months. In the evening, the FOMC meeting will take place, which is when the main volatility is expected. However, it is important to note that significant decisions and announcements are unlikely, so the market may move very sluggishly even in the evening.
Today, traders may consider short positions with a target of 1.3369-1.3377 if the price consolidates below the 1.3465-1.3480 range. Long positions remain relevant with a target of 1.3588, as the price bounced from the 1.3465-1.3480 area.
Price levels of support and resistance – thick red lines, around which the movement may end. They are not sources of trading signals.
Kijun-sen and Senkou Span B lines – lines of the Ichimoku indicator that are carried over to the hourly timeframe from the 4-hour one. They are strong lines.
Extreme levels – thin red lines from which the price has previously bounced. They are sources of trading signals.
Yellow lines – trend lines, trend channels, and any other technical patterns.
Indicator 1 on COT charts – the size of the net position of each category of traders.
InstaForex analytical reviews will make you fully aware of market trends! Being an InstaForex client, you are provided with a large number of free services for efficient trading.


