 Stay
Stay 
Trading Conditions
Products
Tools


The EUR/USD currency pair attempted another rise on Wednesday. Recall that on Tuesday, the euro failed to hold its ground, and optimism about resolving the conflict in the Middle East quickly faded from traders' minds. However, on Wednesday evening, Donald Trump reported that the conflict is nearing its conclusion and that the latest round of negotiations was very productive. According to the U.S. leader, Iran agreed to most of Washington's conditions. This news caused traders to change their sentiment for the third time this week. On Monday, the dollar fell; on Tuesday, it rose; and on Wednesday, it fell again. As we can see, the geopolitical backdrop changes almost daily, and the market continues to trade primarily on insights and information from Trump. For example, Tehran has yet to confirm the success of the negotiations. Thus, the situation remains tense and very unstable. Traders still don't care about the macroeconomic and fundamental background.
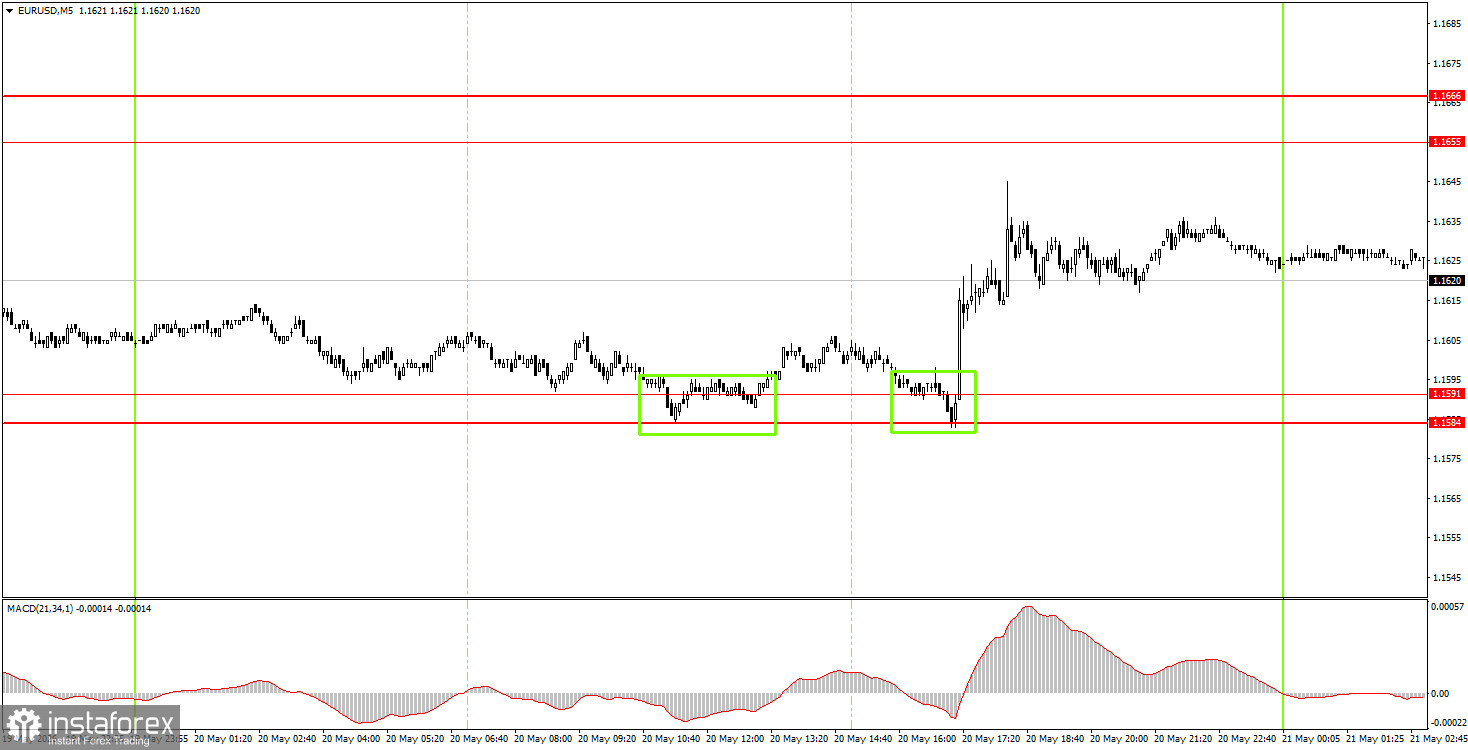
On the 5-minute timeframe on Wednesday, two buy signals were generated. During the European and American trading sessions, the pair bounced twice from the 1.1584-1.1591 range, allowing novice traders to open long positions. Although the euro failed to move higher on the first attempt, by evening, Trump came to its aid.
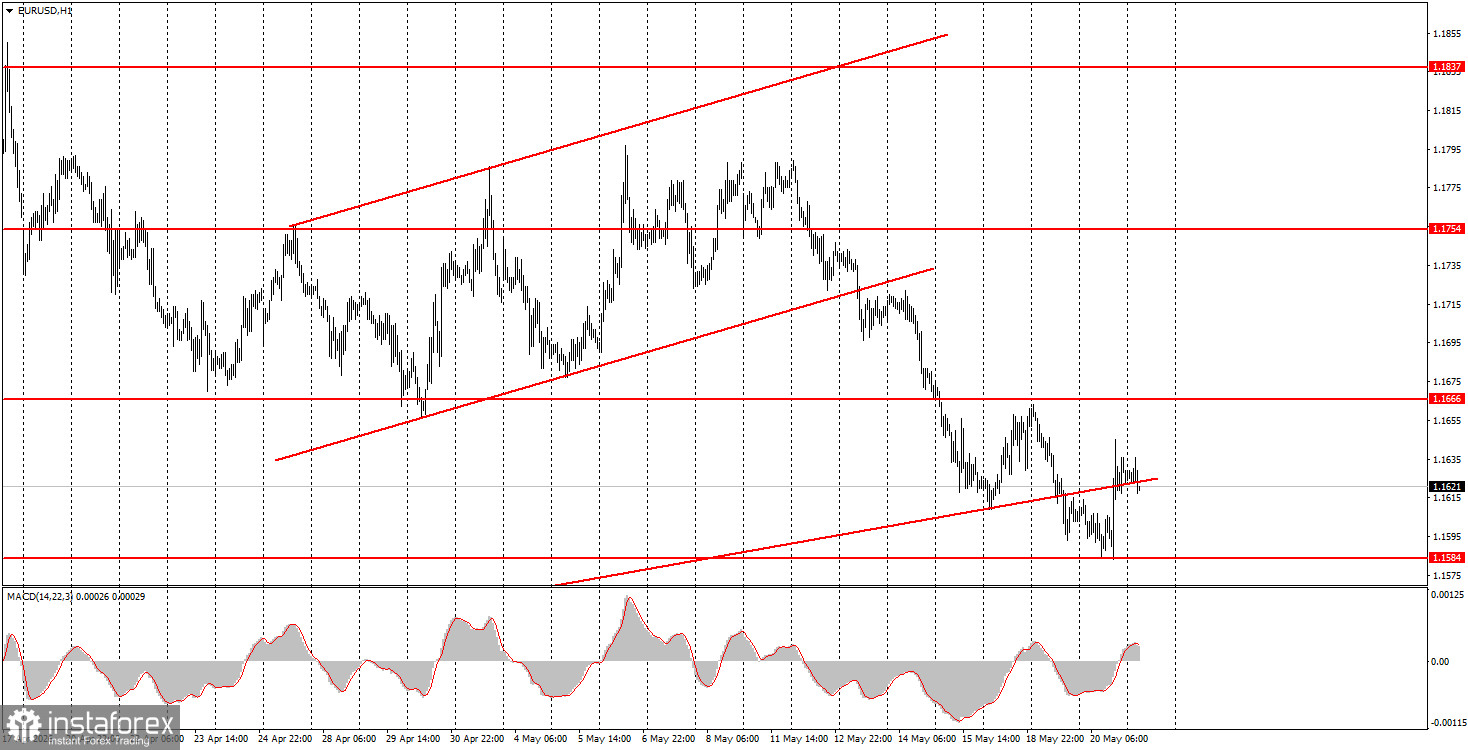
On the hourly timeframe, the euro has been undergoing a correction for an entire month. The U.S. dollar has resumed its rise as the conflict in the Middle East teetered on the brink of escalation last week, but we still do not expect prolonged strength for the U.S. dollar. The market largely continues to ignore fundamentals and macroeconomics, while geopolitical factors cause the EUR/USD pair to swing up and down.
On Thursday, novice traders can open new short positions targeting 1.1584-1.1591 if the price bounces from the 1.1655-1.1666 area. New long positions can be considered on a price bounce from the area of 1.1584-1.1591 with a target of 1.1655-1.1666.
On the 5-minute timeframe, the following levels should be considered: 1.1354-1.1363, 1.1413, 1.1455-1.1474, 1.1527-1.1531, 1.1584-1.1591, 1.1655-1.1666, 1.1745-1.1754, 1.1830-1.1837, 1.1899-1.1908. On Thursday, the Eurozone, Germany, and the U.S. will publish business activity indices for May. Theoretically, European indices may provoke a slight market reaction, but the first three days of the week have shown that traders remain focused solely on geopolitical news.
Price levels (areas) of support and resistance – levels that are targets when opening purchases or sales, or sources of signals.
Red lines – channels or trend lines that display the current trend and indicate which direction is preferable to trade now.
MACD indicator (14, 22, 3) – histogram and signal line – a supporting indicator that can also be used as a source of signals.
Important speeches and reports (contained in the news calendar) can significantly influence the movement of the currency pair. Therefore, during their release, trading should be done as cautiously as possible, or one should exit the market to avoid a sharp price reversal against the preceding movement.
Beginners trading in the Forex market should remember that not every trade can be profitable. Developing a clear strategy and effective money management are key to long-term trading success.
InstaForex analytical reviews will make you fully aware of market trends! Being an InstaForex client, you are provided with a large number of free services for efficient trading.


