 Stay
Stay 
Trading Conditions
Products
Tools


The EUR/USD currency pair once again plummeted on Thursday, but recovered quite quickly. The reason for this is that in the first half of the day, relatively weak business activity indexes for the services and manufacturing sectors were released in the Eurozone and the UK, while in the second half of the day, news emerged that a framework agreement between Iran and the US is ready and may be signed soon. Thus, we saw the euro decline in the first half of the day and the dollar in the second. As we warned, geopolitics continues to "drive" the markets, and almost every significant piece of news can provoke a movement. However, traders often do not know when new information will arrive. Therefore, we frequently observe inexplicable movements that only become clear a few hours later. Currently, a downward trend is still forming, but geopolitics can quickly turn the market in favor of the euro if the information about the imminent agreement is not a "hoax."
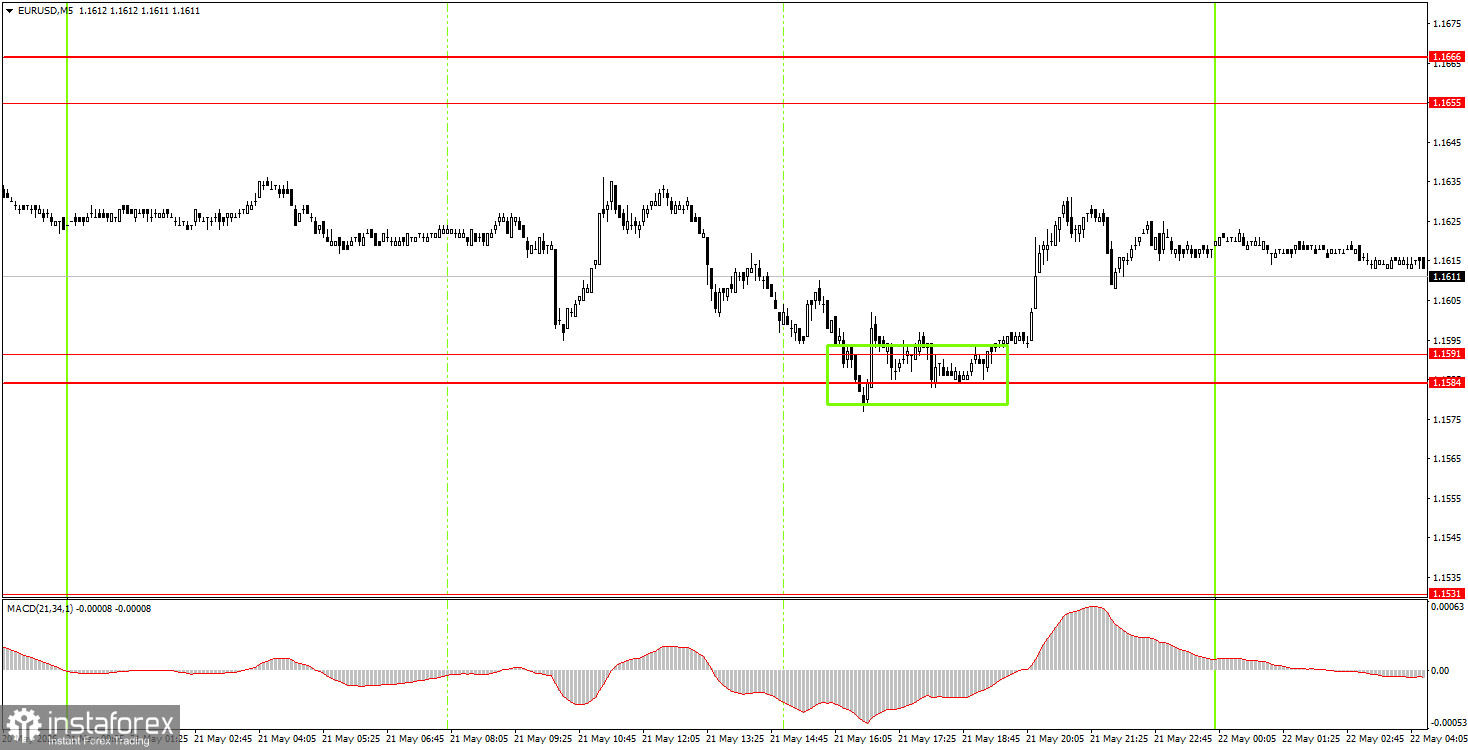
On the 5-minute time frame, only one trading signal was formed on Thursday. During the American trading session, the pair bounced off the 1.1584-1.1591 area, allowing the euro to rise by about 30 pips. Volatility throughout the day, despite the abundance of geopolitical and macroeconomic information, remained weak.
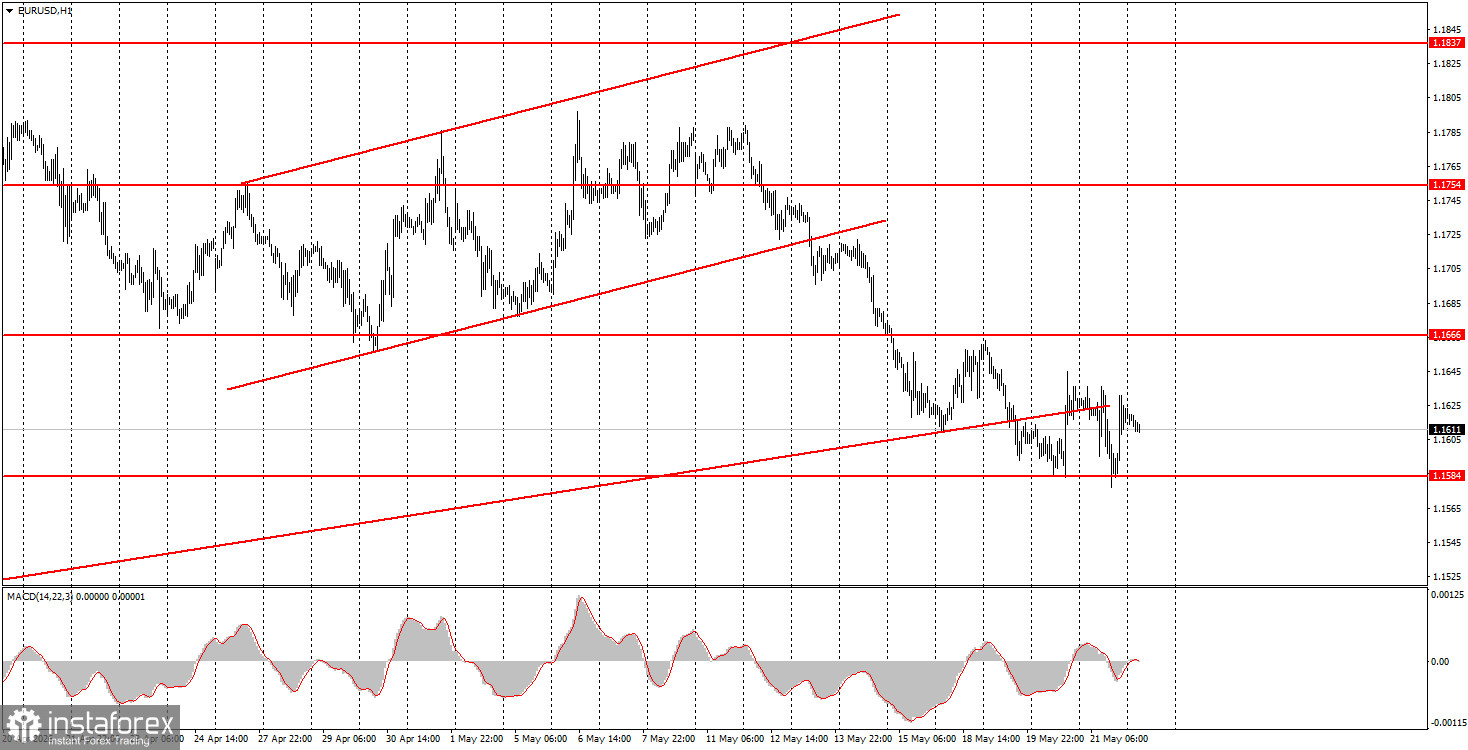
On the hourly time frame, the euro has been correcting for a whole month. The US dollar's growth has resumed, as the conflict in the Middle East was on the verge of escalation last week, but we still do not anticipate significant long-term growth for the American currency. The market continues to largely ignore fundamentals and macroeconomics, while geopolitics swings the EUR/USD pair up and down.
On Friday, novice traders can open new short positions targeting 1.1527-1.1531 if the price settles below the 1.1584-1.1591 area. New long positions can be considered if the price bounces off the 1.1584-1.1591 area, targeting 1.1655-1.1666.
On the 5-minute time frame, levels to consider are 1.1354-1.1363, 1.1413, 1.1455-1.1474, 1.1527-1.1531, 1.1584-1.1591, 1.1655-1.1666, 1.1745-1.1754, 1.1830-1.1837, 1.1899-1.1908. On Friday, the Eurozone calendar of events is completely empty, while in the US, only the second estimate of the University of Michigan consumer sentiment index will be released. Consequently, volatility may again be low today, with geopolitics remaining the key driver.
Price levels (areas) of support and resistance – levels that are targets when opening purchases or sales, or sources of signals.
Red lines – channels or trend lines that display the current trend and indicate which direction is preferable to trade now.
MACD indicator (14, 22, 3) – histogram and signal line – a supporting indicator that can also be used as a source of signals.
Important speeches and reports (contained in the news calendar) can significantly influence the movement of the currency pair. Therefore, during their release, trading should be done as cautiously as possible, or one should exit the market to avoid a sharp price reversal against the preceding movement.
Beginners trading in the Forex market should remember that not every trade can be profitable. Developing a clear strategy and effective money management are key to long-term trading success.
InstaForex analytical reviews will make you fully aware of market trends! Being an InstaForex client, you are provided with a large number of free services for efficient trading.


