 Stay
Stay 

Trading Conditions
Products
Tools


The EUR/USD currency pair traded with low volatility on Tuesday, showing no notable movements, as seen on the 5-minute timeframe. There were no noteworthy reports throughout the day from either the Eurozone or the U.S., and the market began to ignore geopolitical news once again, as it has grown tired of the ever-changing geopolitical backdrop. Yesterday, it was revealed that just when negotiations were at their peak, and "five minutes before signing the deal," the U.S. struck in southern Iran near the Strait of Hormuz. There's no need to delve into which targets were hit. The fact remains that negotiations were once again on the brink of collapse, just as the ceasefire between Tehran and Washington was. Interestingly, the dollar did not rise at all. Thus, the market is no longer willing to react to every strike, every piece of news, every statement. Volatility continues to decline, reflecting the market's reluctance to trade on unverified or meaningless messages.
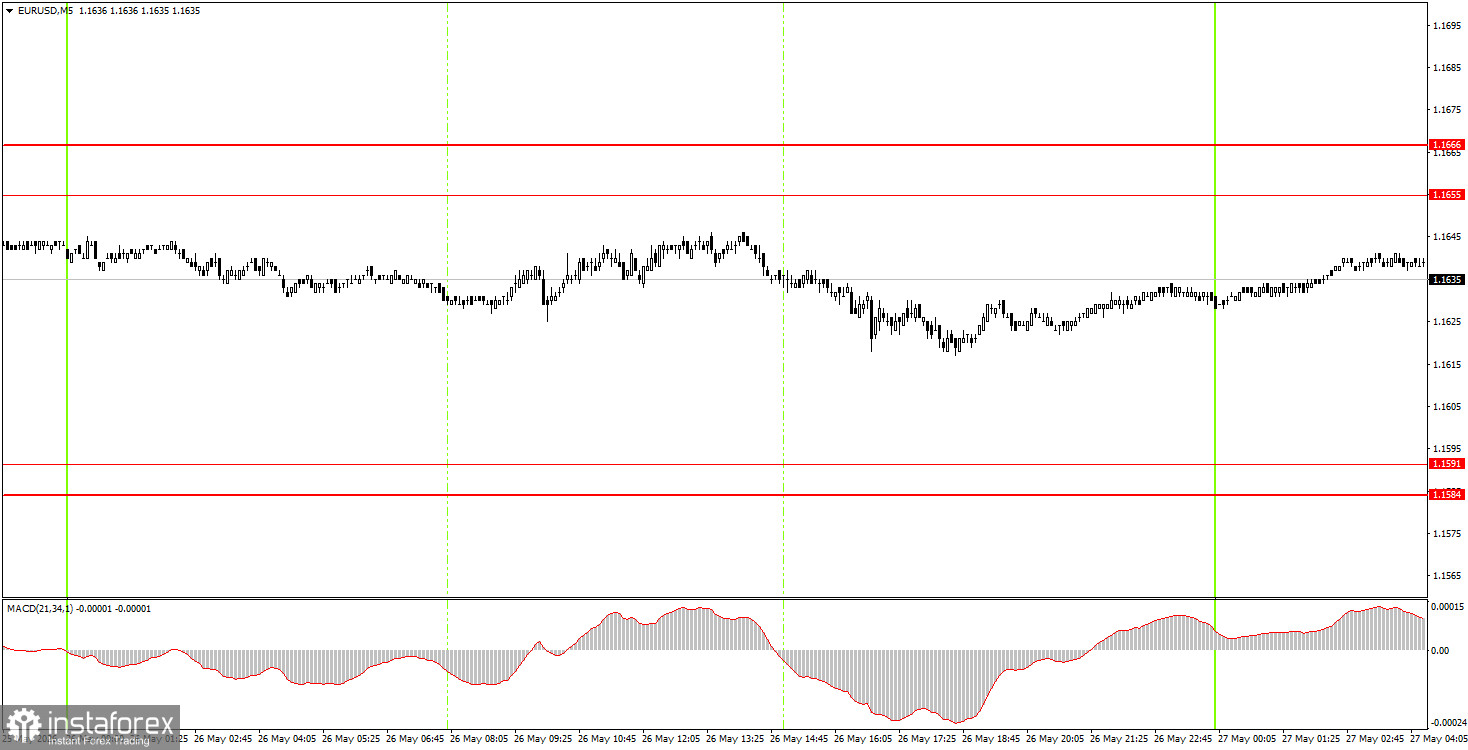
On the 5-minute timeframe, no trading signals were formed on Tuesday. Throughout the day, the euro moved 30 pips from its minimum to its maximum, without approaching any significant areas or levels. Therefore, traders had no basis for opening positions.
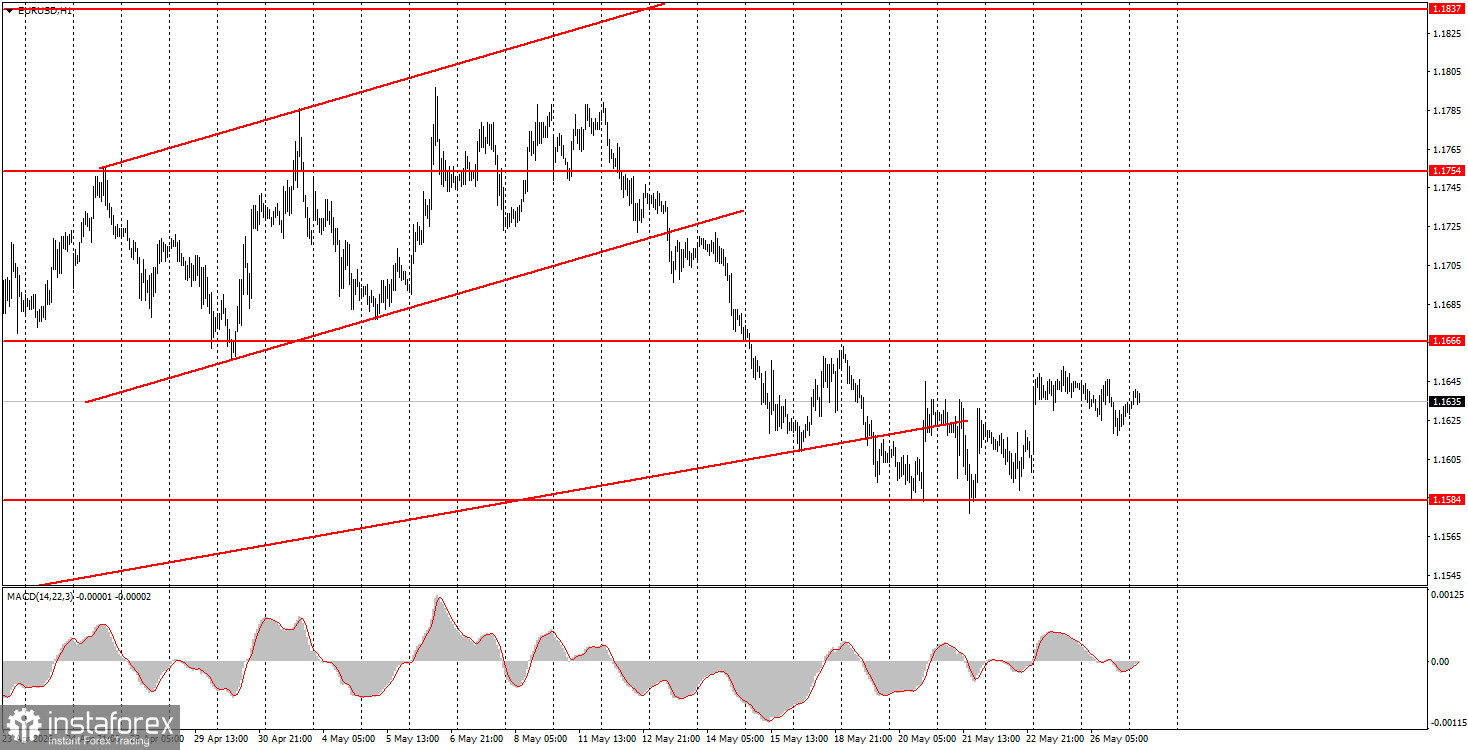
On the hourly timeframe, the euro has been in a corrective phase for a whole month. The growth of the American currency resumed last week as the conflict in the Middle East was on the brink of escalation, but we still do not anticipate prolonged dollar strength. The market largely continues to ignore fundamentals and macroeconomics, while geopolitics swings the EUR/USD pair up and down.
On Wednesday, novice traders may stay in short positions targeting 1.1584-1.1591, as the price has bounced from the 1.1655-1.1666 area back on Monday. New long positions can be considered upon the price consolidating above the 1.1655-1.1666 area, targeting 1.1745-1.1754.
On the 5-minute timeframe, levels to consider include 1.1354-1.1363, 1.1413, 1.1455-1.1474, 1.1527-1.1531, 1.1584-1.1591, 1.1655-1.1666, 1.1745-1.1754, 1.1830-1.1837, and 1.1899-1.1908. On Wednesday, there are again no significant events or reports scheduled in the Eurozone or the U.S., and the market will await geopolitical developments and confirmations of Trump's weekend statements, as well as the consequences of the U.S. attack on Iran, on Tuesday.
Price levels (areas) of support and resistance – levels that are targets when opening purchases or sales, or sources of signals.
Red lines – channels or trend lines that display the current trend and indicate which direction is preferable to trade now.
MACD indicator (14, 22, 3) – histogram and signal line – a supporting indicator that can also be used as a source of signals.
Important speeches and reports (contained in the news calendar) can significantly influence the movement of the currency pair. Therefore, during their release, trading should be done as cautiously as possible, or one should exit the market to avoid a sharp price reversal against the preceding movement.
Beginners trading in the Forex market should remember that not every trade can be profitable. Developing a clear strategy and effective money management are key to long-term trading success.
InstaForex analytical reviews will make you fully aware of market trends! Being an InstaForex client, you are provided with a large number of free services for efficient trading.


