 Stay
Stay 
Trading Conditions
Products
Tools


Bitcoin and Ethereum are finally showing signs of completing a three-month upward correction. Liquidity pools remain below, with a 90% probability that the price will find them. Structural breakdowns, sell signals, and bearish patterns are forming for both major cryptocurrencies. Therefore, we remain poised for declines in both Ethereum and Bitcoin, even if they are not swift.
Meanwhile, Swissblock reported that the Bitcoin risk index has reached 33 points, indicating a "high-risk zone." The company noted an increase in institutional sales of "digital gold" and a sharp influx of Bitcoin onto cryptocurrency exchanges. All this suggests that traders and investors largely do not believe in further growth of the first cryptocurrency and are trying to offload it whenever possible.
It's important to remember that the $78,000-$80,000 range was previously deemed "key" because it encompassed the average buying levels for Bitcoin among most traders over the past year. Since traders did not anticipate significant growth, many found themselves in losses and drawdowns when Bitcoin fell below this marked area. As a result, after recovering to this area, traders began to close losing positions at breakeven, increasing Bitcoin supply and driving prices down, triggering a new wave of selling.
Swissblock also noted that the inflow of spot capital into Bitcoin ETFs is no longer capable of offsetting the overall pressure from sellers. In other words, demand is currently lower than supply, especially spot demand, which becomes the basis for "big trends." The conclusion is that Bitcoin is not ready for a new "bullish" rally. Glassnode noted that net capital outflows from Bitcoin ETFs have been recorded almost daily since May 7. It seems that the forecasts of Michael Saylor, Cathie Wood, and Robert Kiyosaki will have to wait.
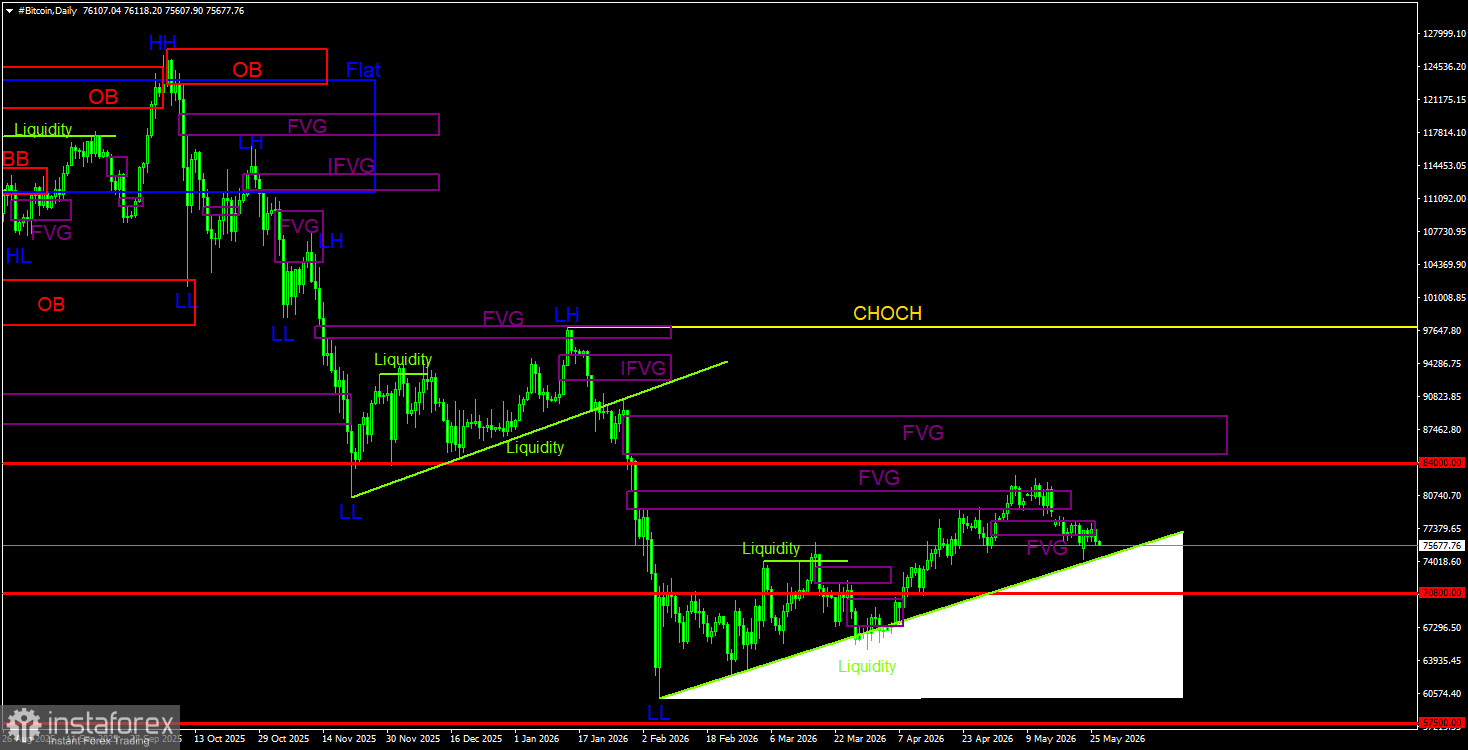
Bitcoin continues to form a full-fledged downward trend and correction against it. We expect a decline targeting $57,500 (the 61.8% Fibonacci retracement level from the three-year upward trend), and there are still no signs of a long-term upward trend beginning. Among the points of interest (POI), the nearest "bearish" FVG on the daily timeframe is in the $79,300-$81,200 range. A sell signal was formed in this area (after the second attempt) and received confirmation on the hourly timeframe. Thus, in the near term, we are focused on resuming the downward trend, and bearish patterns remain a priority. While long positions are permissible in the short term, it should be remembered that upward spikes may be weak and corrective.
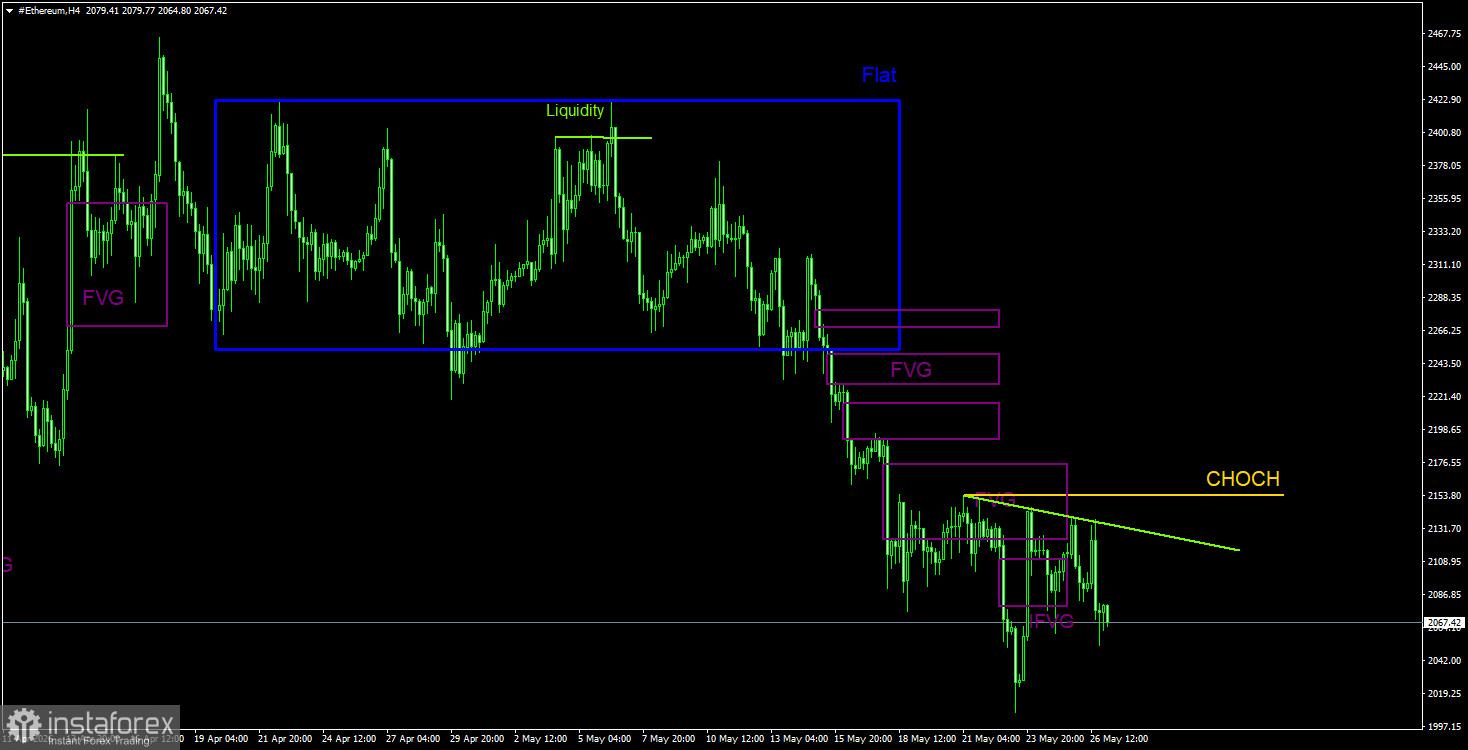
On the daily timeframe, the downward trend and correction against it continue. Ethereum may continue to decline, as signs of completing a three-month correction are becoming increasingly apparent for both Ethereum and Bitcoin. Recently, no new patterns have formed on the daily timeframe, as movements remain quite weak. On the 4-hour timeframe, the trend is downward, so bearish patterns can be used to open short positions. The target remains at $1,742. Bullish patterns and buy signals cannot be deemed safe, as both cryptocurrencies are aimed at a new phase of the downward trend.
InstaForex analytical reviews will make you fully aware of market trends! Being an InstaForex client, you are provided with a large number of free services for efficient trading.


