 Stay
Stay 
Trading Conditions
Products
Tools


The GBP/USD pair moved similarly to the EUR/USD pair on Monday. Initially, the pound fell significantly before almost completely recovering. However, it should be noted that the Eurozone's unemployment rate could have triggered the euro's decline, but it is irrelevant to the British pound. When the ISM report was released in the US, the dollar's rise stopped, and it began to fall, despite the index exceeding forecasts. Thus, once again, it cannot be said that the market worked off the macroeconomic backdrop; rather, the movements were completely opposite to the macroeconomic releases. No significant geopolitical news was reported on Monday, and the British pound's movement remains similar to that of the euro—practically flat, with a slight upward tilt. Overall, the market is currently in no hurry to buy or sell, as the level of geopolitical uncertainty remains very high.
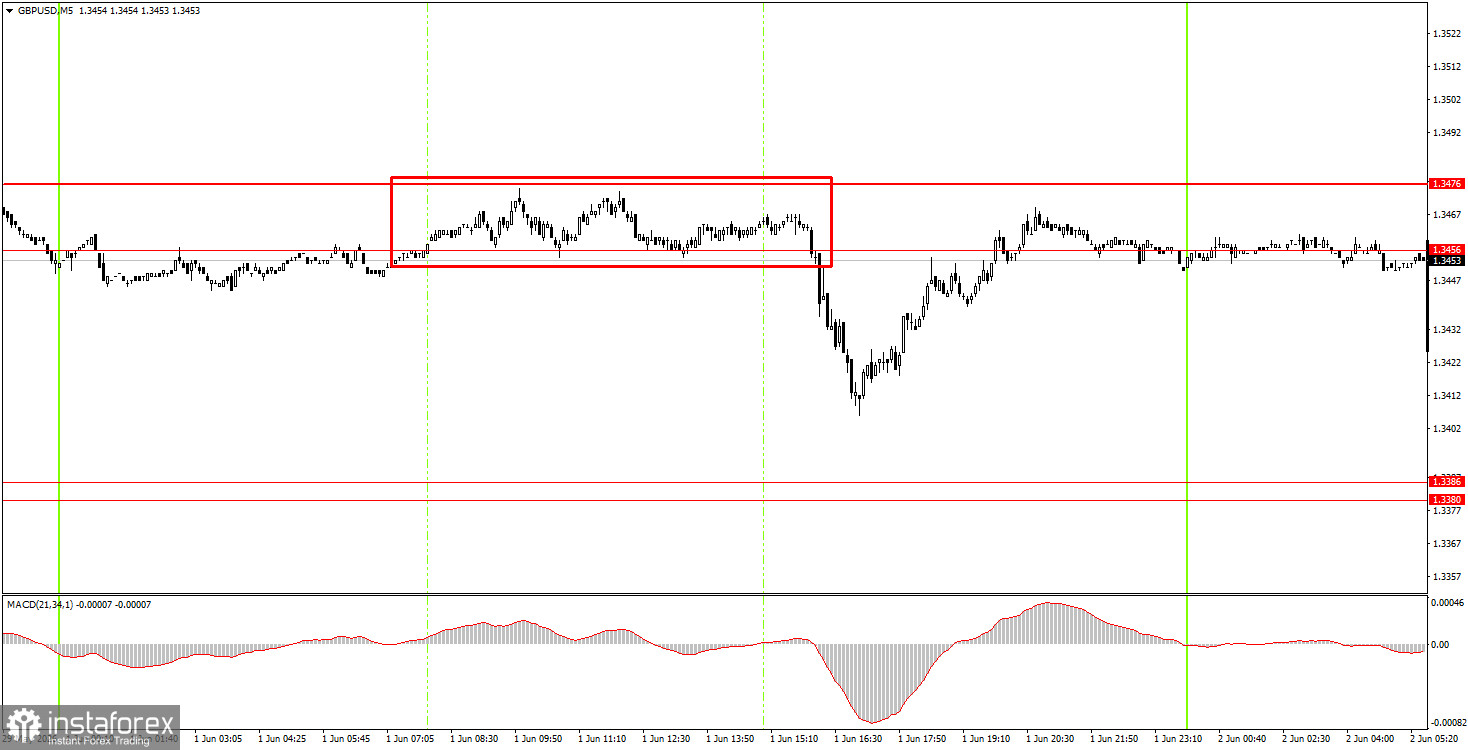
On the 5-minute timeframe, one trading signal was generated on Monday, and a similar one may form this morning. During the US trading session, the price bounced from the 1.3456-1.3476 area and moved down about 30-35 pips before quickly returning to its initial levels. Therefore, a profit from the short position could only be realized if the trade was manually closed "in the air," as the target area of 1.3380-1.3386 was not fully achieved.
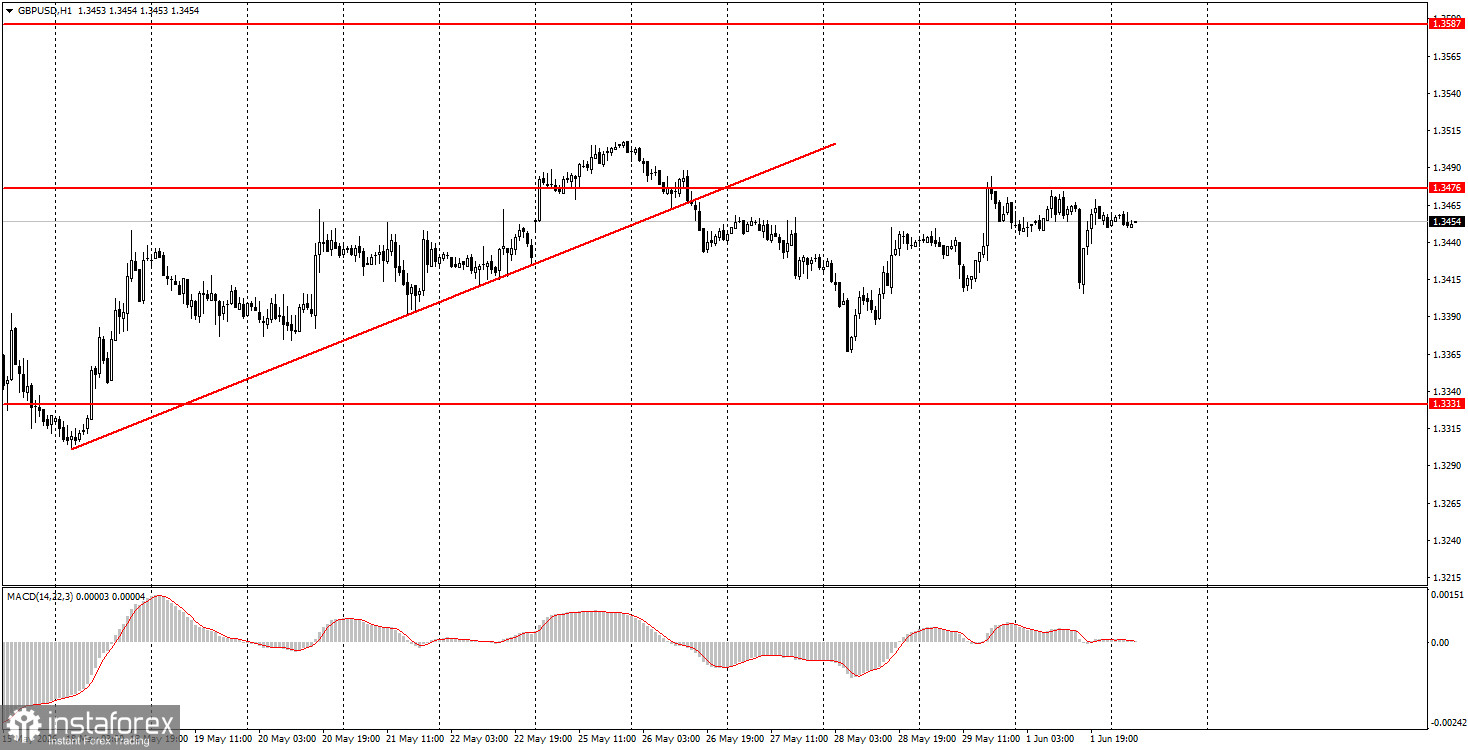
On the hourly timeframe, the GBP/USD pair continues to establish a downward trend, as geopolitics has again deteriorated and the trend line has been breached. However, without a resumption of full-scale war in the Middle East, the dollar cannot expect to rise as it did in February-March. Certain events may still provoke a strengthening, but we do not believe the market will trigger a new wave of risk aversion.
On Tuesday, beginner traders can open short positions targeting 1.3380-1.3386 if the price bounces from the 1.3456-1.3476 area. If the price consolidates above the 1.3456-1.3476 area, long positions can be opened targeting 1.3587-1.3598.
On the 5-minute timeframe, levels to consider include 1.3175-1.3180, 1.3259-1.3267, 1.3319-1.3331, 1.3380-1.3386, 1.3456-1.3476, 1.3587-1.3598, 1.3631-1.3641, 1.3695, and 1.3741-1.3751. The calendar remains empty for events in the UK on Tuesday, and in the US, a not-so-significant JOLTS report on job openings for April will be released. Movements today may once again be technical and weak.
Price levels (areas) of support and resistance are targets when opening long or short positions or sources of signals.
Red lines indicate channels or trend lines that display the current trend and indicate the preferred direction for trading.
The MACD indicator (14,22,3) – histogram and signal line – is a supplementary indicator that can also be used as a source of signals.
Important speeches and reports (contained in the news calendar) can significantly impact the movement of the currency pair. Therefore, during their release, trading should be conducted with maximum caution, or one should exit the market to avoid sharp reversals against preceding movements.
Beginners trading in the forex market should remember that not every trade can be profitable. Developing a clear strategy and practicing money management are keys to success in trading over the long term.
InstaForex analytical reviews will make you fully aware of market trends! Being an InstaForex client, you are provided with a large number of free services for efficient trading.


