 Stay
Stay 
Trading Conditions
Products
Tools


The GBP/USD currency pair traded quite sluggishly on Wednesday, despite significant news from the Middle East and overseas. Let's start with the economic data. In the US, the ISM business activity index was published yesterday and exceeded forecasts, following the manufacturing index. As such, the dollar had economic grounds for growth yesterday. Additionally, it was reported later in the evening that Iran had launched a missile strike on Kuwait's international airport, clearly indicating the continuation of the conflict in the Middle East. Kuwait is an ally of the US. Essentially, traders received another answer to the question: "Should we expect a peace agreement between Tehran and Washington anytime soon?" Our response over the past few weeks has been no, as there are no real grounds for such an agreement, but practically daily missile attacks in the Persian Gulf region continue.
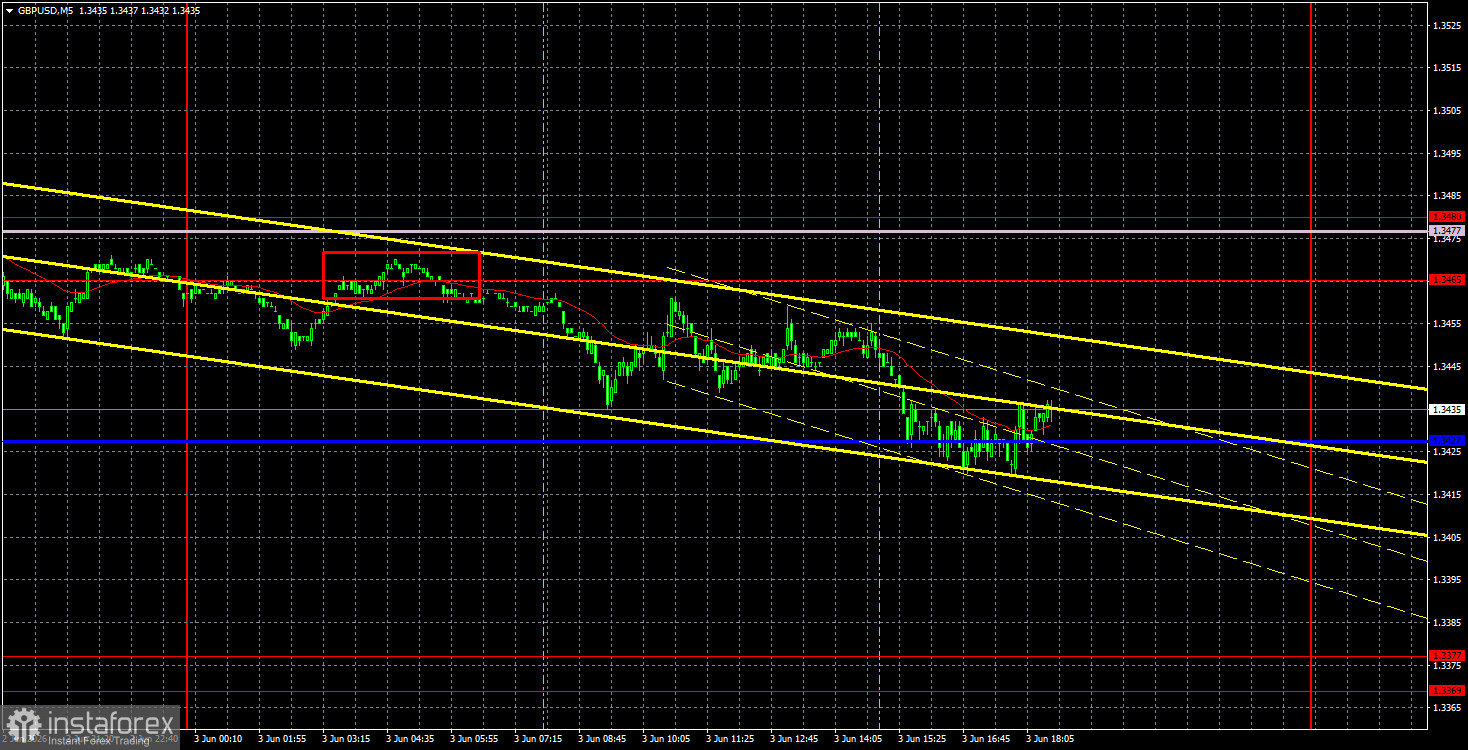
From a technical standpoint, the downward trend began after breaking the trend line, but in recent weeks, the price has been tightly stuck between 1.3369-1.3377 and 1.3465-1.3480. The upper boundary of this channel could not be breached, so we may soon observe movement towards the lower boundary. Geopolitics remains uncertain, meaning the pound may continue to stay within the sideways channel until the situation clarifies.
On the 5-minute timeframe on Wednesday, one sell trading signal was formed. Just before the European trading session opened, the price bounced off the 1.3465-1.3480 area and then dropped to the Kijun-sen line at 1.3427 by the end of the day. Thus, traders could have secured a profit of 25-30 pips from the short position, which is quite a decent result given the current volatility.
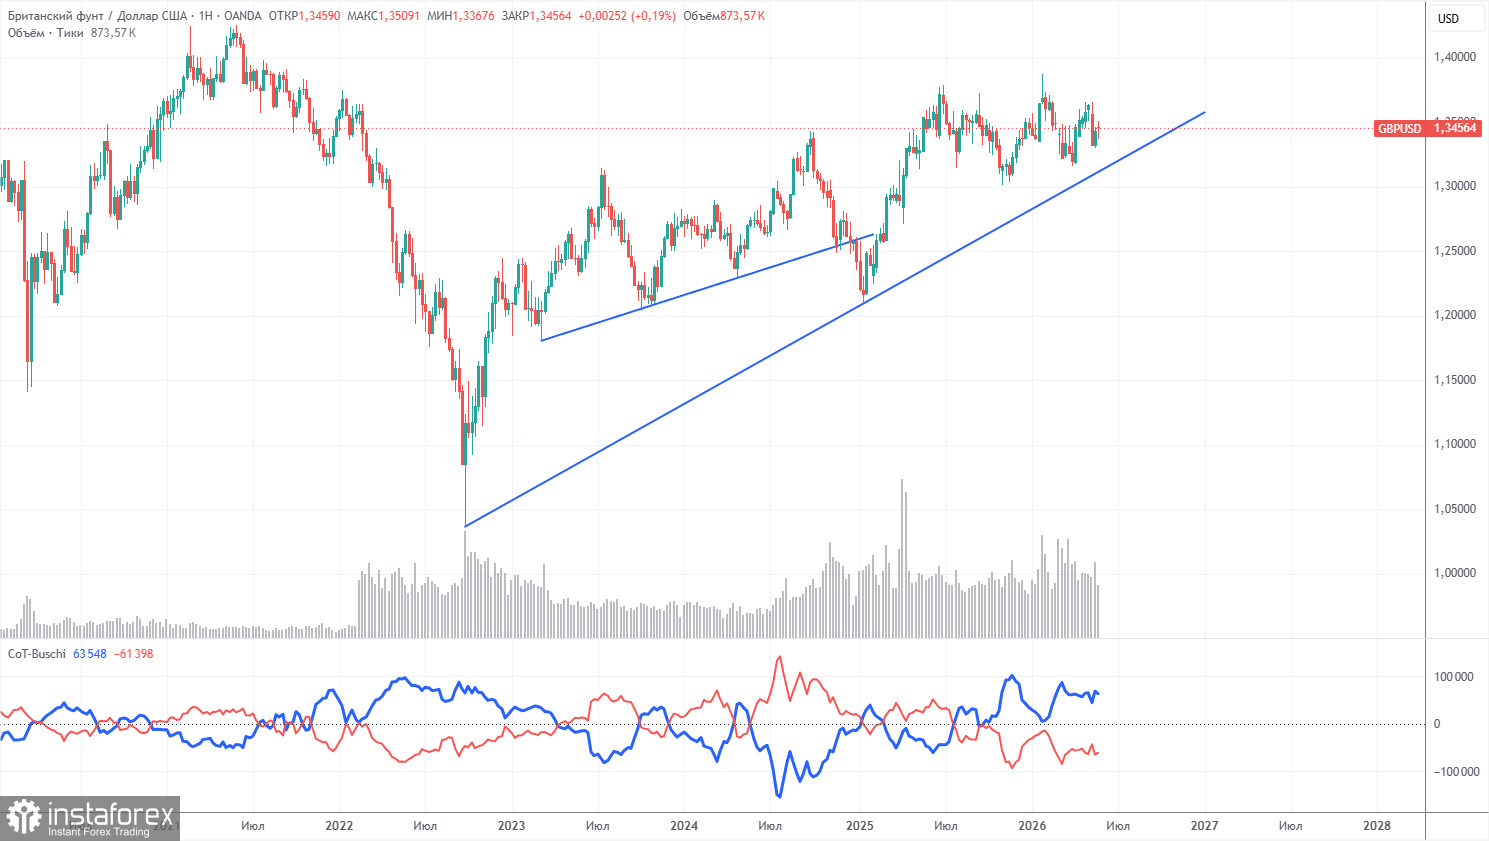
COT reports for the British pound show that, in recent years, sentiment among commercial traders has been continually shifting. The red and blue lines, which reflect the net positions of commercial and non-commercial traders, frequently intersect and are mostly close to the zero mark. Currently, the lines are diverging, with non-commercial traders continuing to dominate with... shorts. Given the events in the Middle East, it is no surprise that demand for riskier currencies is falling while demand for the dollar is rising.
In the long term, the dollar continues to decline due to Trump's policies, as evidenced by the weekly timeframe (illustration above). The trade war will persist in one form or another for a long time, and Trump's policies are aimed, both directly and indirectly, at weakening the American currency. However, geopolitical factors currently take precedence, providing significant support for the dollar. Since the conflict in the Middle East cannot be declared resolved, the US dollar may still see potential growth in the future. According to the latest COT report (as of May 26), the Non-Commercial group closed 10,100 buy contracts and 13,000 sell contracts. As a result, the net position of non-commercial traders increased by 3,100 contracts over the week.
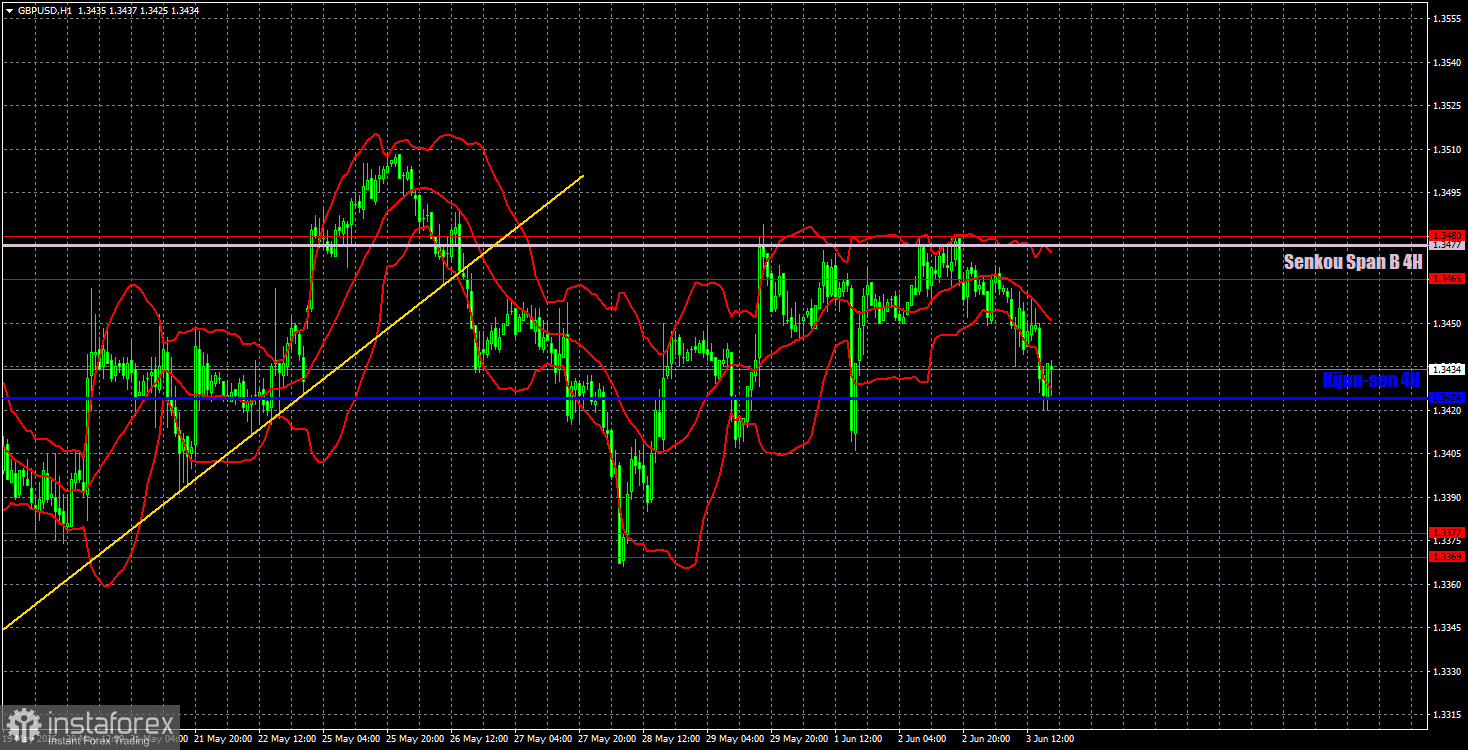
On the hourly timeframe, the GBP/USD pair has completed its upward trend amid renewed tensions in the Strait of Hormuz and strained relations between Iran and the US. The macroeconomic and fundamental backdrop continues to have little influence on the pair's movements. We do not believe that the dollar can show strong growth without a real escalation of the conflict in the Middle East; however, the situation is indeed moving towards escalation.
For June 4, we highlight the following important levels: 1.3096-1.3115, 1.3179-1.3187, 1.3369-1.3377, 1.3465-1.3480, 1.3588, 1.3671-1.3681, and 1.3751-1.3763. The Senkou Span B line (1.3477) and the Kijun-sen line (1.3424) may also serve as signal sources. It is recommended to set a Stop Loss to break even if the price moves in the correct direction by 20 pips. The Ichimoku indicator lines may shift throughout the day, so this should be taken into account when determining trading signals.
On Thursday, the Governor of the Bank of England, Andrew Bailey, is scheduled to speak, and in the US, the jobless claims report will be published. It is unlikely that there will be any significant reactions to either of these events. However, a new escalation in the Middle East may occur. The dollar could continue its upward movement towards the 1.3369-1.3377 area.
Today, traders may maintain short positions targeting 1.3369-1.3377, as the pair has bounced off the 1.3465-1.3480 area. Long positions will become relevant if there's a rebound from the 1.3369-1.3377 area, targeting 1.3465-1.3480.
InstaForex analytical reviews will make you fully aware of market trends! Being an InstaForex client, you are provided with a large number of free services for efficient trading.


