 Stay
Stay 
Trading Conditions
Products
Tools


The EUR/USD currency pair continued to decline sharply on Wednesday, reflecting a significant strengthening of the U.S. dollar. One might wonder why this is happening. What accounts for the sudden and strong rise of the U.S. dollar? Yes, the results of the Federal Reserve meeting were more hawkish, and the Monetary Committee declared its readiness to raise rates by the end of the year to combat high inflation. However, the Fed has not raised rates yet, while the European Central Bank did so last week. The market ignored the ECB meeting results, while the potential Fed rate hike has been priced in for the past two days. Furthermore, there were no significant events or reports on Thursday in either the U.S. or the EU. The geopolitical conflict in Iran is coming to an end, and oil prices are falling; there is no longer a need to flee from risks. So why is the dollar rising? In our view, there is no clear answer. The dollar is rising because market makers are buying it. This could be a trap—a trap for bears in the EUR/USD pair.
From a technical standpoint, the euro's decline on Wednesday and Thursday triggered a resumption of the downward trend. However, FOMC meetings occur every six weeks, and the market continues to ignore most macroeconomic factors. Thus, the dollar's rise on Wednesday was logical, but on Thursday, it was less so. We believe that the dollar has ridden its luck and is taking full advantage of it. At this time, no leading analysts are forecasting growth for the U.S. currency.
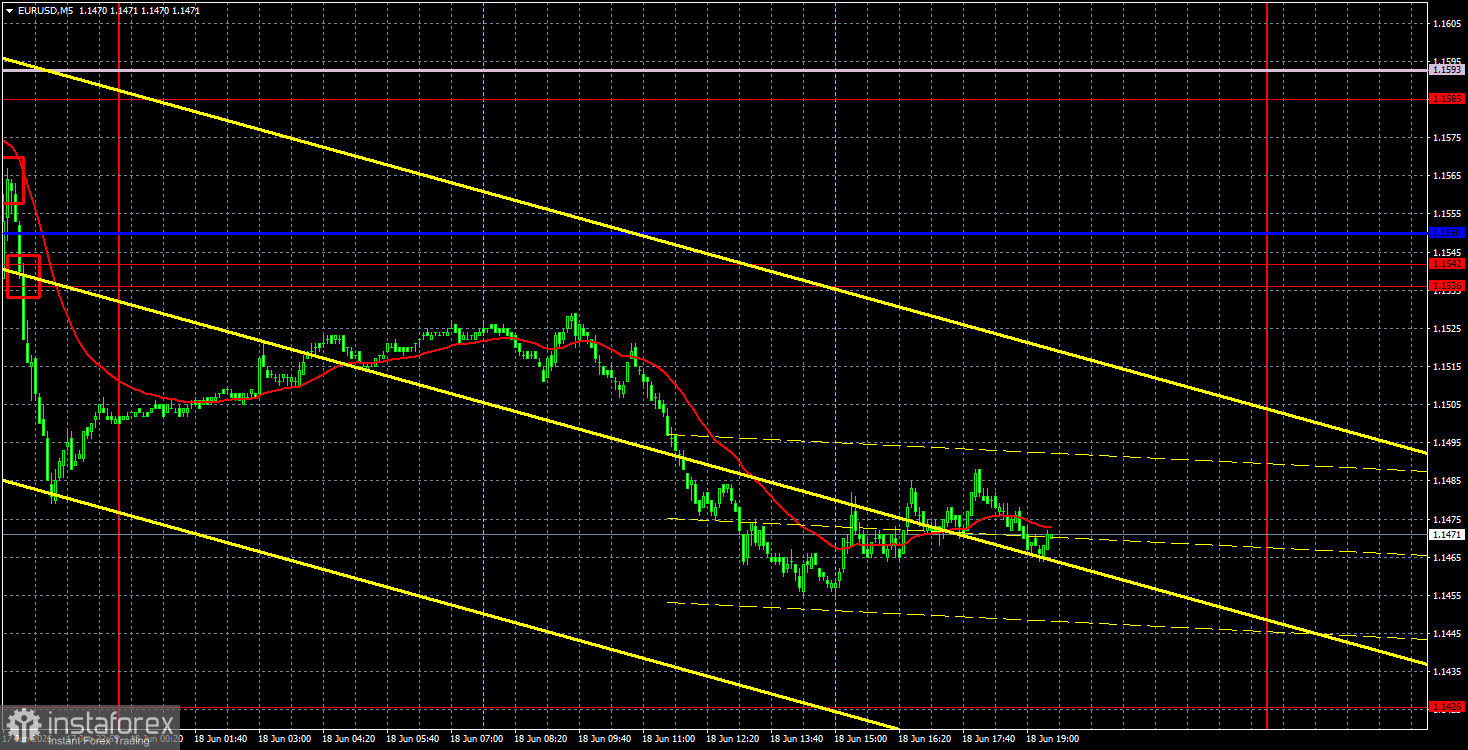
On the 5-minute timeframe, no trading signals were formed on Thursday despite the high volatility. During the European trading session, the price was just shy of adequately addressing the area of 1.1536-1.1542.
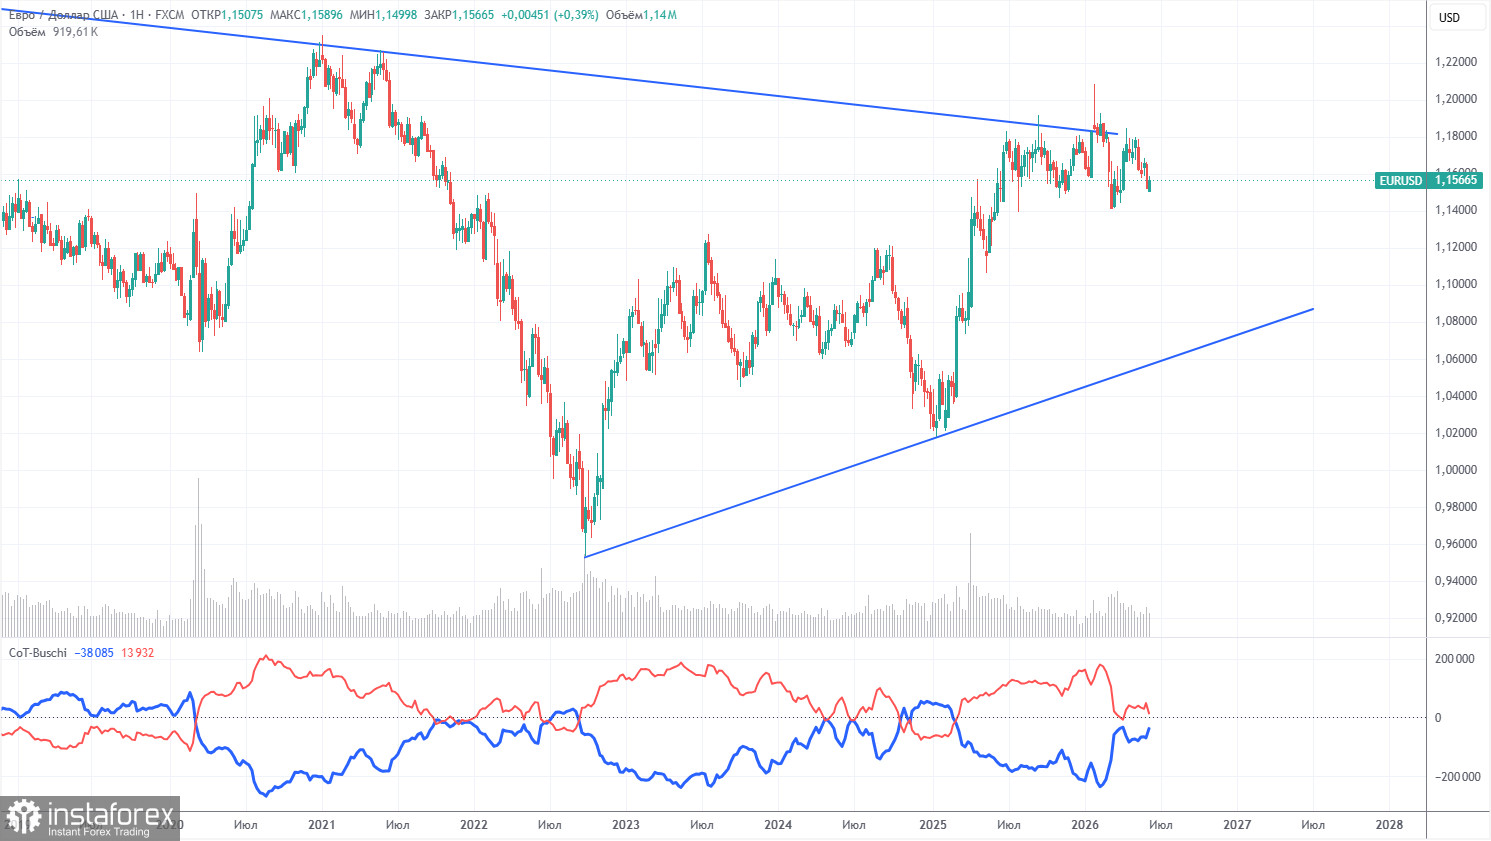
The latest COT report is dated June 9. The illustration on the weekly timeframe clearly shows that the net position of non-commercial traders remains "bullish," but has significantly decreased due to geopolitical events. Traders have been offloading the European currency in favor of the U.S. dollar in recent months. Trump's policies have not changed, but the dollar has acted as a "reserve currency" for a time. However, this process may have already come to an end.
We still do not see any fundamental factors supporting the strengthening of the European currency, while there are adequate factors for the U.S. dollar to decline. The war in the Middle East made the dollar temporarily super attractive, but when this factor reaches its "expiration date," everything will return to normal. And that may have already happened. In the long term, the euro could fall to as low as $1.08 (the trend line), but the upward trend will remain relevant. Over the last few months, the pair has not approached this line significantly.
The arrangement of the red and blue lines in the indicator indicates parity between bulls and bears. During the last reporting week, the number of longs in the "Non-commercial" group decreased by 15,900, while the number of shorts increased by 19,000. Consequently, the net position fell by 34,900 contracts over the week.
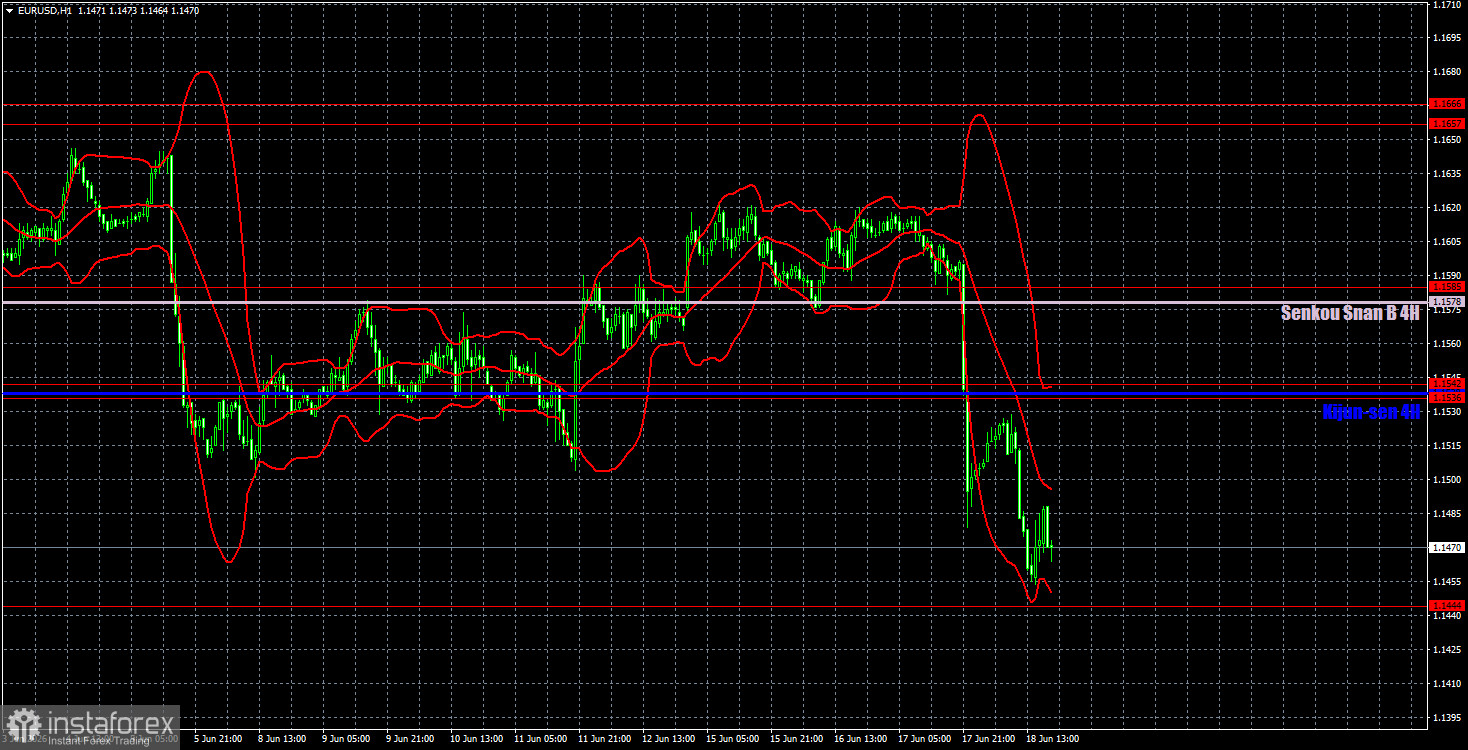
On the hourly timeframe, the upward trend has been canceled, while the continuation of the downward movement is in question. The situation in the Middle East has resolved, meaning the dollar can no longer rely on geopolitical support. The Fed provided powerful support for the U.S. currency on Wednesday, but it is difficult to say why the decline continued on Thursday. The market continues to buy the dollar without reason, ignoring factors favoring the euro.
For June 19, we outline the following trading levels: 1.1362, 1.1426, 1.1536-1.1542, 1.1585, 1.1657-1.1666, 1.1750-1.1760, 1.1786, 1.1830-1.1837, 1.1907-1.1922, as well as the Senkou Span B line (1.1578) and the Kijun-sen line (1.1550). The lines of the Ichimoku indicator may shift throughout the day, which should be considered when determining trading signals. Don't forget to set a stop-loss order at breakeven if the price moves in the correct direction by 15 pips. This will protect against potential losses if the signal proves false.
On Friday, no significant events or reports are scheduled in the EU or the U.S. After two days of decline in the EUR/USD pair, it might be time for a pause. Unless the market continues to sell purely on inertia, which is also possible. We believe there are no strong reasons for the dollar's current growth.
Today, traders can open short positions targeting 1.1362 if the price surpasses 1.1444. Long positions can be initiated with targets of 1.1536-1.1542 if the pair bounces from the 1.1444 level.
InstaForex analytical reviews will make you fully aware of market trends! Being an InstaForex client, you are provided with a large number of free services for efficient trading.


