 Stay
Stay 
Trading Conditions
Products
Tools


Trade Breakdown and Trading Advice for the Japanese Yen
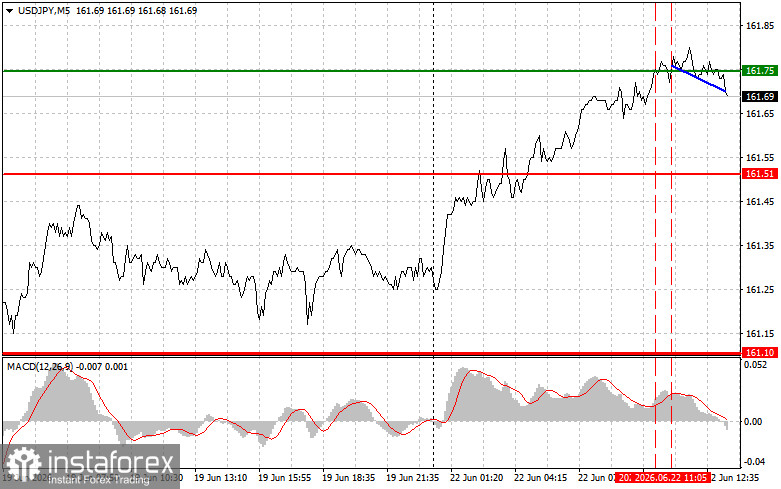
A price test of 161.75 occurred at a moment when the MACD indicator had already moved significantly upward from the zero line, which limited the pair's upward potential. A second test of 161.75 occurred when the MACD was in overbought territory, which triggered the execution of Scenario #2 for selling the dollar. However, a significant decline in the pair has not yet occurred.
During the U.S. trading session, no major U.S. macroeconomic data is expected, which shifts full attention to the upcoming speech by FOMC member Christopher Waller. Of particular interest are his potential comments regarding the Federal Reserve's recent decision to keep interest rates unchanged while revising expectations toward a more hawkish stance. Any hints from Waller in favor of maintaining tight monetary policy could lead to a significant strengthening of the dollar against the yen, which has recently fallen to its yearly lows. Any unexpected statements or new information related to monetary policy or its interaction with external economic factors will be quickly interpreted by traders and analysts, potentially leading to notable moves in USD/JPY and possibly prompting intervention considerations from the Bank of Japan.
Regarding intraday strategy, I will mainly rely on the execution of scenarios #1 and #2.
Buy Signal
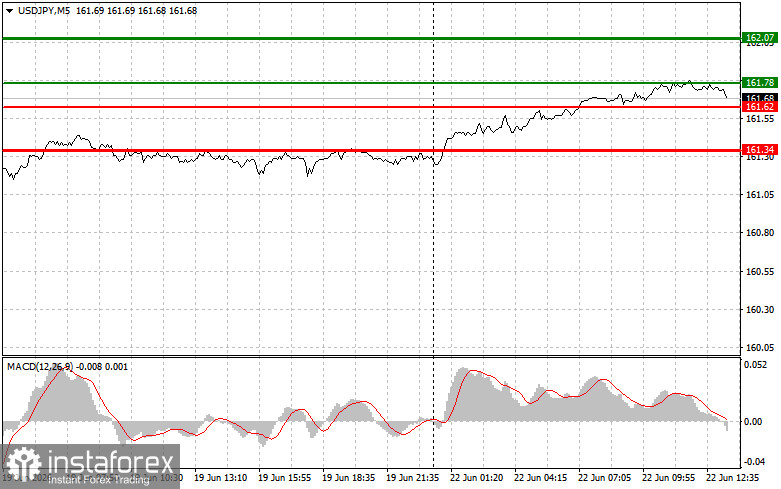
Scenario #1: Today I plan to buy USD/JPY at an entry point around 161.78 (green line on the chart), with a target of 162.07 (thicker green line on the chart). Around 162.07 I will exit long positions and open short positions in the opposite direction (expecting a 30–35 point reversal from that level). A strong rally in the pair today is possible but remains limited. Important! Before buying, make sure the MACD indicator is above the zero line and has just started rising from it.
Scenario #2: I will also consider buying USD/JPY if there are two consecutive tests of the 161.62 level at a time when the MACD indicator is in oversold territory. This would limit downward potential and trigger an upward reversal. A move toward the opposite levels of 161.78 and 162.07 can be expected.
Sell Signal
Scenario #1: I plan to sell USD/JPY after a break below the 161.62 level (red line on the chart), which should lead to a rapid decline in the pair. The key target for sellers is 161.34, where I will exit short positions and immediately open long positions in the opposite direction (expecting a 20–25 point rebound). Downward pressure on the pair may return today in the event of central bank intervention. Important! Before selling, make sure the MACD indicator is below the zero line and has just started moving downward from it.
Scenario #2: I will also consider selling USD/JPY if there are two consecutive tests of the 161.78 level at a time when the MACD indicator is in overbought territory. This would limit upward potential and trigger a downward reversal. A decline toward the opposite levels of 161.62 and 161.34 can be expected.
What is shown on the chart:
Important: Beginner Forex traders should be very cautious when making market entry decisions. Before major fundamental data releases, it is best to stay out of the market to avoid sharp price fluctuations. If you decide to trade during news events, always place stop-loss orders to minimize losses. Without stop-loss orders, you may quickly lose your entire deposit, especially if you do not use proper money management and trade large volumes.
Remember that successful trading requires a clear trading plan, similar to the one presented above. Spontaneous trading decisions based on current market conditions are an inherently losing strategy for intraday traders.
InstaForex analytical reviews will make you fully aware of market trends! Being an InstaForex client, you are provided with a large number of free services for efficient trading.


