 Stay
Stay 
Trading Conditions
Products
Tools


The EUR/USD currency pair continued its downward movement during Wednesday's trading, with only a minimal attempt to correct by the end of the day. There were no significant macroeconomic reports in the Eurozone, Germany, or the U.S. yesterday. Therefore, the movements during the day were not prompted by macroeconomic data. The same applies to fundamental events and geopolitical news. The negotiations between Iran and the U.S. again demonstrate contradictory statements from both sides, but they are still progressing. Tehran and Washington do not want a new war, providing hope for a long-term agreement. Regarding fundamental events, they are now dependent on geopolitics. If the conflict in the Middle East is indeed over, inflation will begin to slow, and oil prices have already dropped to pre-war levels. As a result, monetary policy tightening may not be necessary in the near future. However, all of this information is currently of little significance, as the market continues to ignore nearly all news flow.
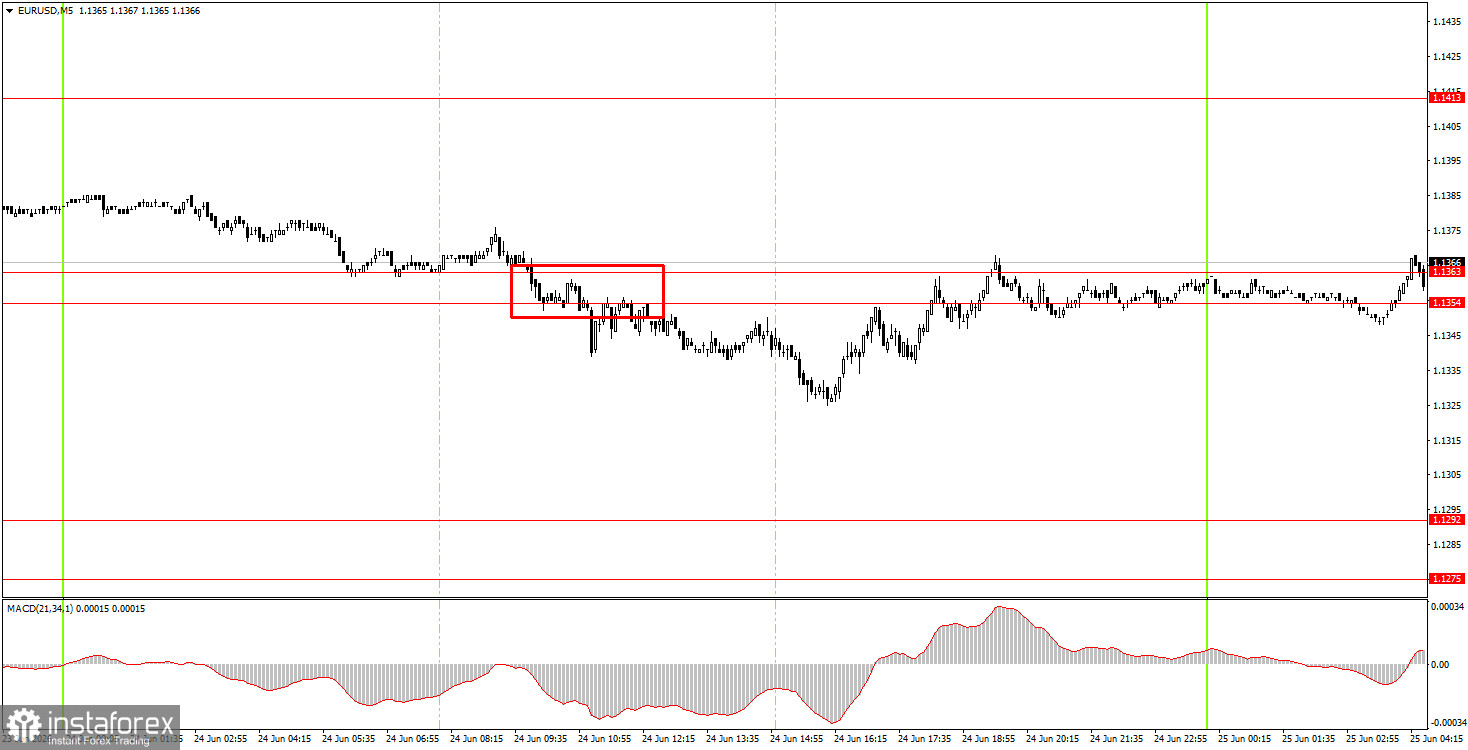
On the 5-minute timeframe, only one trading signal was generated on Wednesday. During the European trading session, the pair settled below the 1.1354-1.1363 area but failed to develop a southward momentum throughout the day and returned to this area by evening. Today, trades can again be opened from this level.
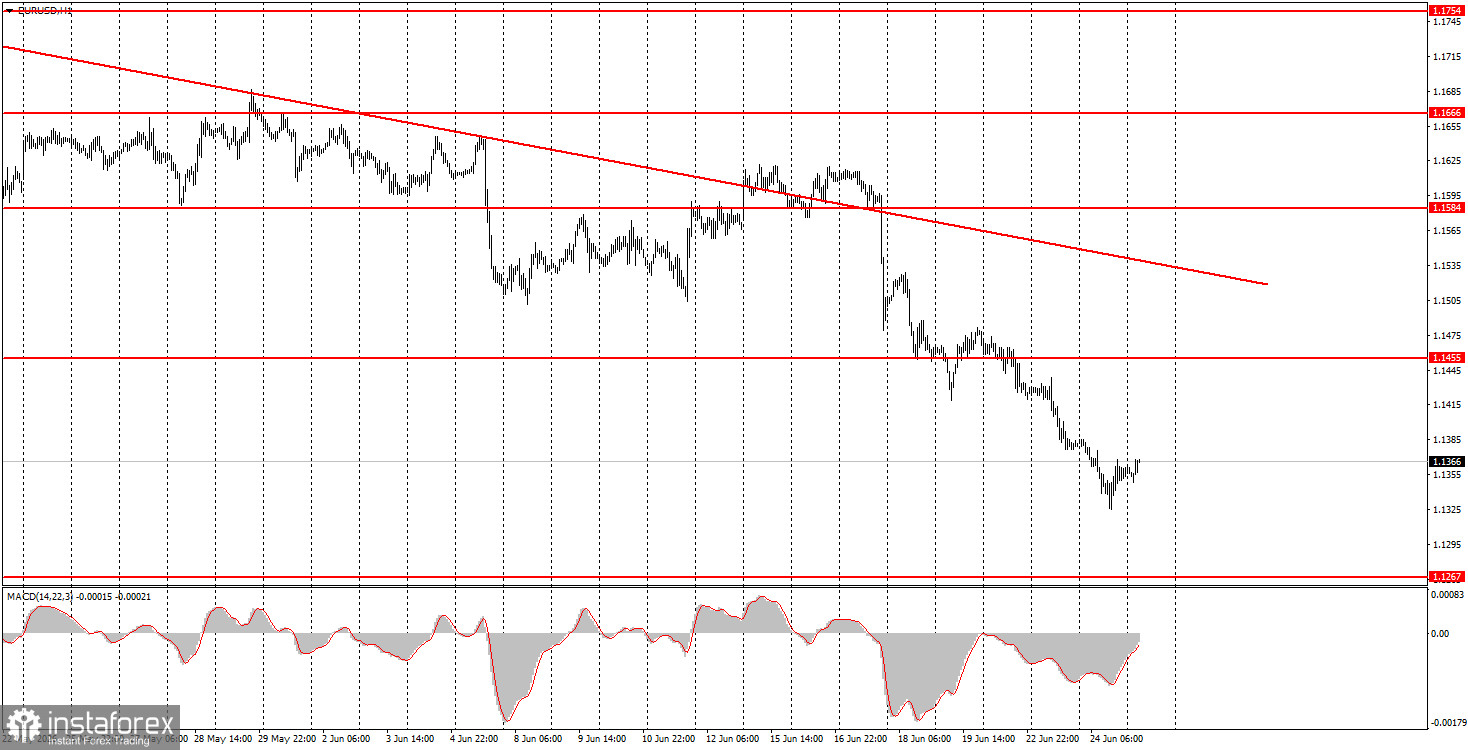
On the hourly timeframe, the downward trend continues. Since the deal between Iran and the U.S. has been signed, the market has one less reason to buy the U.S. dollar. However, the market pays no attention to this factor and generally ignores almost all factors in favor of the euro. Thus, the current strengthening of the U.S. dollar lacks a clear rationale.
On Thursday, novice traders can open short positions targeting 1.1292 if the price consolidates below the 1.1354-1.1363 area. Long positions can be opened with a target of 1.1413 if the price consolidates above the 1.1354-1.1363 area.
On the 5-minute timeframe, consider the following levels: 1.1292, 1.1354-1.1363, 1.1413, 1.1455-1.1474, 1.1527-1.1531, 1.1584-1.1594, 1.1655-1.1666, 1.1745-1.1754, and 1.1830-1.1837. On Thursday, there are no significant events planned in the Eurozone, and the U.S. will release several important reports, including the third estimate of first-quarter GDP and the durable goods orders report. However, there is no confidence that the market will pay attention to these reports.
Price levels (areas) of support and resistance are targets when opening long or short positions or sources of signals.
Red lines indicate channels or trend lines that display the current trend and indicate the preferred direction for trading.
The MACD indicator (14,22,3) – histogram and signal line – is a supplementary indicator that can also be used as a source of signals.
Important speeches and reports (contained in the news calendar) can significantly impact the movement of the currency pair. Therefore, during their release, trading should be conducted with maximum caution, or one should exit the market to avoid sharp reversals against preceding movements.
Beginners trading in the forex market should remember that not every trade can be profitable. Developing a clear strategy and practicing money management are key to long-term success in trading.
InstaForex analytical reviews will make you fully aware of market trends! Being an InstaForex client, you are provided with a large number of free services for efficient trading.


