 Stay
Stay 
Trading Conditions
Products
Tools


The GBP/USD pair continued its downward movement on Wednesday for no objective reason. By the end of the day, the British pound began to recover, but even a 40-pip rise can hardly be considered a "pullback" given that the pair had lost 300 pips over the week. Thus, the downward trend remains intact. Since there are currently no reasons for the U.S. dollar to rise, the pair may continue to decline indefinitely. We advise novice traders to make decisions based on technical analysis now, rather than waiting for movements driven solely by significant events or reports. The dollar has been rising for an entire week. It is evident that this movement will not last forever, but its justification raises very serious questions. The largest dissonance arises from geopolitics. The conflict in the Middle East is over, the Strait of Hormuz is open, and oil prices have fully retraced the increases of February and March. However, instead of the expected decline in the "safe dollar," we see strong growth that has lasted for a week. It looks very much like manipulation by large capital.
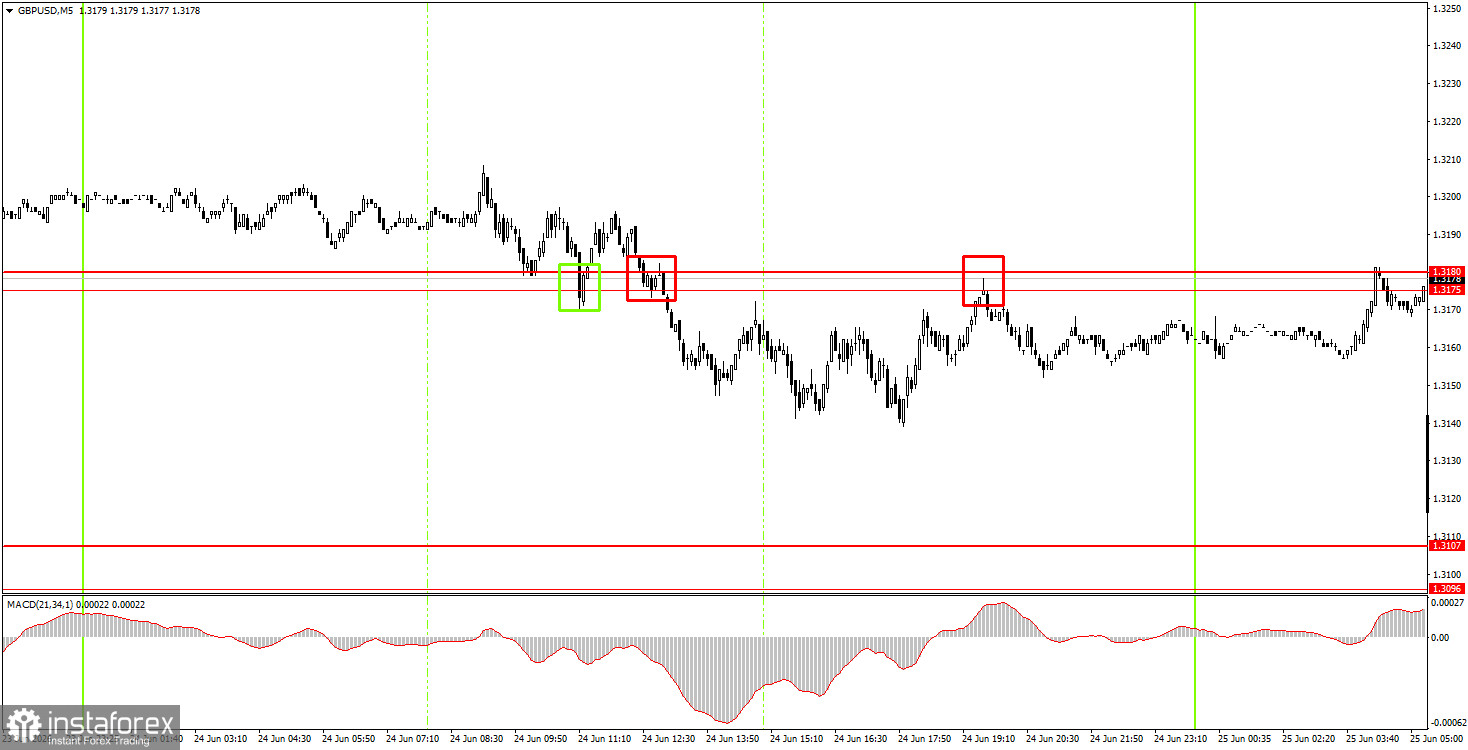
On the 5-minute timeframe on Wednesday, three trading signals were generated. The first buy signal in the area of 1.3175-1.3180 proved false, while the two subsequent sell signals were also effectively false, but they allowed novice traders to avoid losses. Thus, Wednesday was not the best day for trading, but the market is currently moving without logic.
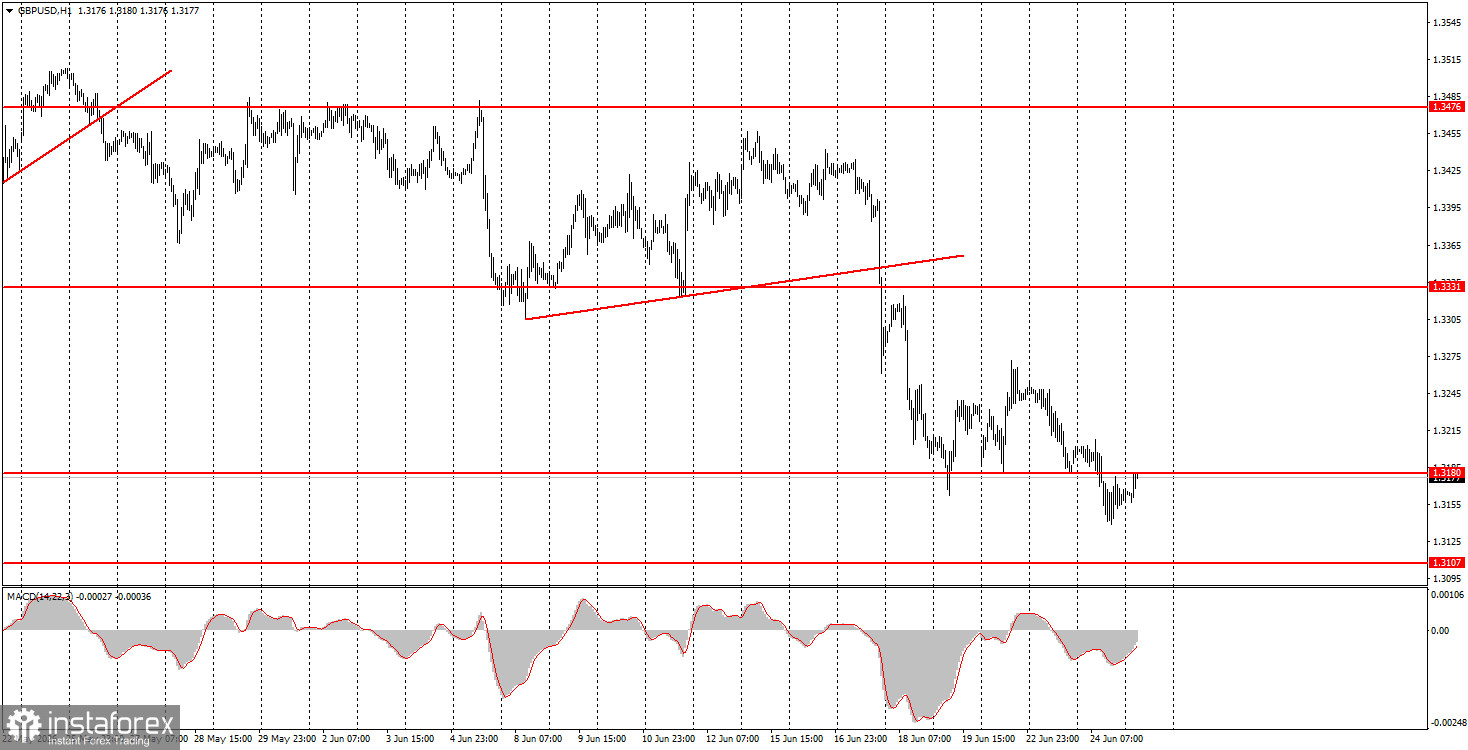
On the hourly timeframe, the GBP/USD pair has left its range channel, but we doubt that the decline will continue for long. Of course, if significant reasons for a new strengthening of the dollar arise, this scenario is possible. However, we do not see them at this time. The conflict in the Middle East is either fully resolved or is on hold, and the Federal Reserve has only declared a possible rate hike by the end of the year, which may not happen.
On Thursday, novice traders can open new short positions targeting 1.3096-1.3107 if the price rebounds from the 1.3175-1.3180 area. A price consolidation above the area of 1.3175-1.3180 will allow for opening long positions targeting 1.3259-1.3267. Volatility has noticeably decreased in recent days, which should be taken into account.
On the 5-minute timeframe, traders can currently consider the following levels: 1.3043, 1.3096-1.3107, 1.3175-1.3180, 1.3259-1.3267, 1.3319-1.3331, 1.3380-1.3386, 1.3456-1.3476, 1.3587-1.3598, 1.3631-1.3641, and 1.3695. On Thursday, there are no significant data scheduled in the UK, while the U.S. will release several reports worth watching, including the first-quarter GDP report and the durable goods orders report.
Price levels (areas) of support and resistance are targets when opening long or short positions or sources of signals.
Red lines indicate channels or trend lines that display the current trend and indicate the preferred direction for trading.
The MACD indicator (14,22,3) – histogram and signal line – is a supplementary indicator that can also be used as a source of signals.
Important speeches and reports (contained in the news calendar) can significantly impact the movement of the currency pair. Therefore, during their release, trading should be conducted with maximum caution, or one should exit the market to avoid sharp reversals against preceding movements.
Beginners trading in the forex market should remember that not every trade can be profitable. Developing a clear strategy and practicing money management are key to long-term success in trading.
InstaForex analytical reviews will make you fully aware of market trends! Being an InstaForex client, you are provided with a large number of free services for efficient trading.


