 Stay
Stay 
Trading Conditions
Products
Tools


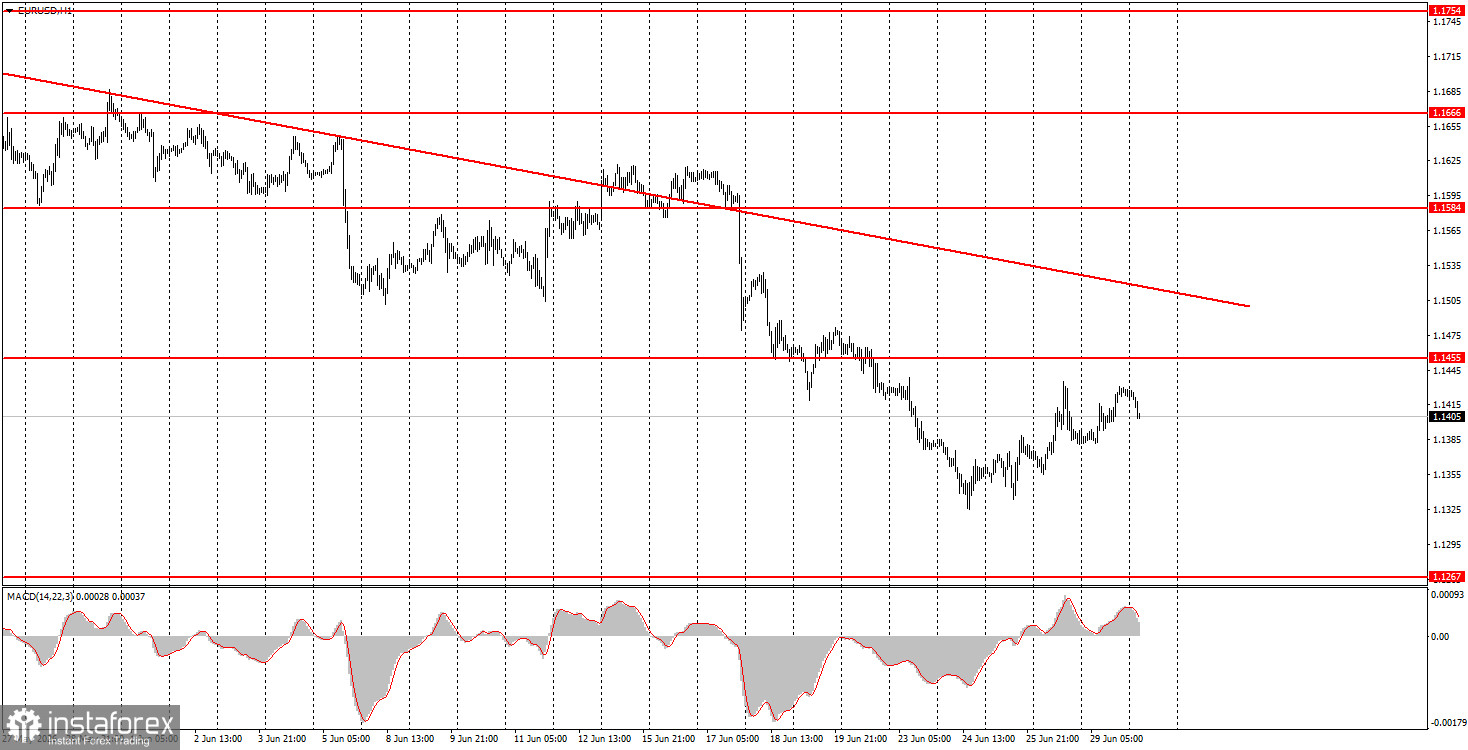
The EUR/USD currency pair continued its weak upward correction on Monday but remains below the trend line, meaning the downward trend persists. This has been the case for two months. Despite such a prolonged decline, the upward trend on higher timeframes remains intact, and we remain skeptical of the justification for the US dollar's two-month rise. However, one cannot dictate to the market. Illogical movements also occur, and this is precisely such a period. Yesterday, Christine Lagarde confirmed the European Central Bank's commitment to tightening monetary policy, noting that the situation in the Middle East is very fragile, with parties to the conflict regularly striking despite the ceasefire. Inflation in the Eurozone exceeds the ECB's target, so the central bank will do everything necessary to bring it back within target. Naturally, this information was ignored by the market, which overall pays no attention to positive factors for the euro.
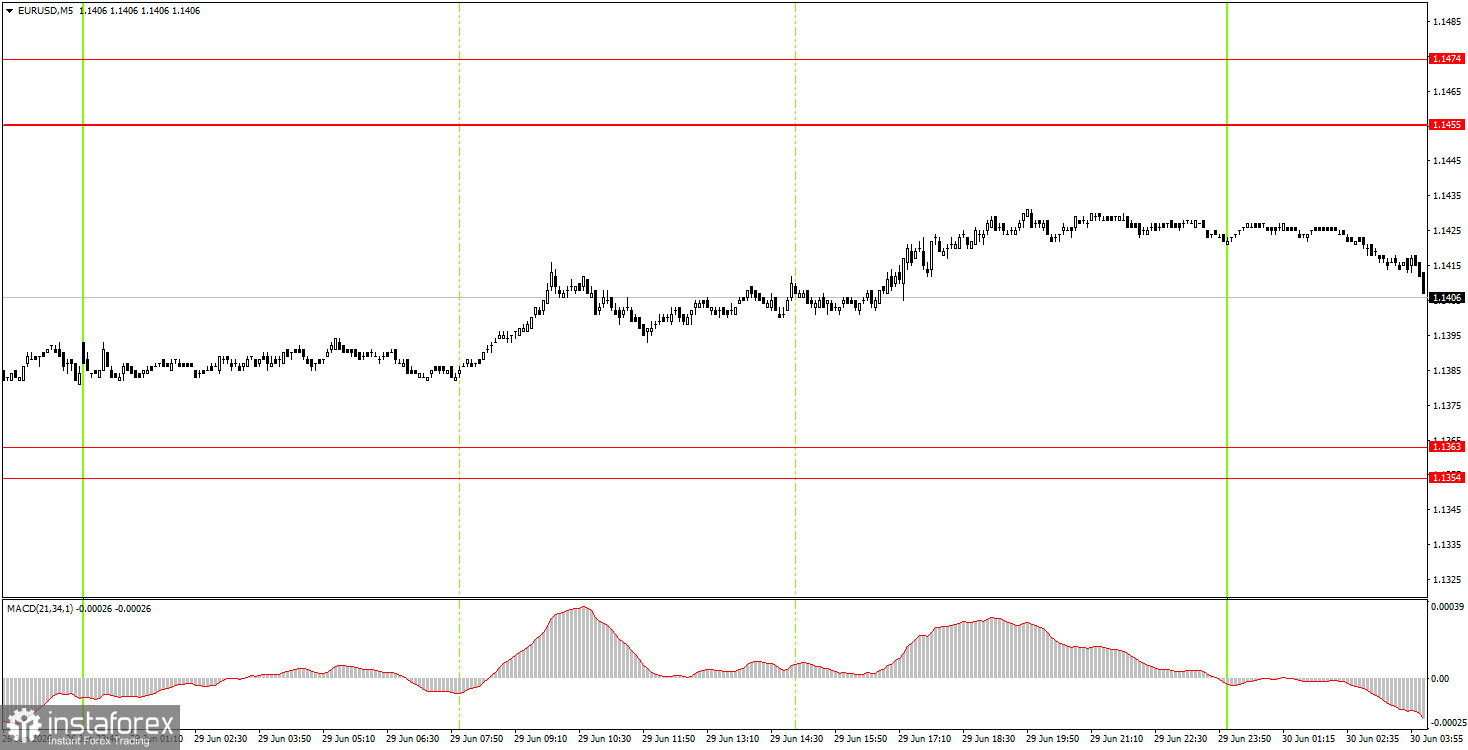
On the 5-minute timeframe on Monday, no trading signals were formed. Throughout the day, the pair showed volatility of about 50 pips. Thus, Monday was quite a dull day, with the market paying no heed to geopolitical events in the Middle East or to Lagarde's speech. We continue to regard the last surge in the US dollar as speculative.
On the hourly timeframe, the downward trend continues despite the breakout of the trend line. Since the deal between Iran and the US was signed, the market has one less reason to buy the US currency. However, the market pays no attention to this fact and is largely ignoring almost all factors in favor of the euro. Therefore, the current strengthening of the US dollar lacks clear and understandable reasons.
On Tuesday, novice traders may consider opening short positions targeting 1.1354-1.1363 if the price bounces from the 1.1455-1.1474 area. Long positions can be opened targeting 1.1455-1.1474 if the price bounces from the 1.1354-1.1363 area. Volatility may again be low, which should be taken into account.
On the 5-minute timeframe, the following levels should be considered: 1.1292, 1.1354-1.1363, 1.1455-1.1474, 1.1527-1.1531, 1.1584-1.1594, 1.1655-1.1666, 1.1745-1.1754, and 1.1830-1.1837. On Tuesday, important data on unemployment and inflation will be published in Germany, but the market is unlikely to react aggressively to them. The same applies to the JOLTs report on job openings in the US. The macroeconomic background remains a low priority for traders.
Price levels (areas) of support and resistance are targets when opening long or short positions or sources of signals.
Red lines indicate channels or trend lines that display the current trend and indicate the preferred direction for trading.
The MACD indicator (14,22,3) – histogram and signal line – is a supplementary indicator that can also be used as a source of signals.
Important speeches and reports (contained in the news calendar) can significantly impact the movement of the currency pair. Therefore, during their release, trading should be conducted with maximum caution, or one should exit the market to avoid sharp reversals against preceding movements.
Beginners trading in the forex market should remember that not every trade can be profitable. Developing a clear strategy and practicing money management are key to long-term success in trading.
InstaForex analytical reviews will make you fully aware of market trends! Being an InstaForex client, you are provided with a large number of free services for efficient trading.


