 Stay
Stay 
Trading Conditions
Products
Tools



According to a new report from one of the leading digital-asset firms, stablecoins are viewed less like an instrument only for crypto traders and more like a full-fledged settlement layer for traditional financial assets.
The data show that in the first half of 2026, the volume of trading in perpetual contracts on traditional assets settled in stablecoins exceeded $1.1 trillion, which is about 11% of the total volume of perpetual crypto contracts for the first five months of the year. This refers to so-called TradFi futures on stock and commodity markets — instruments that give traders exposure to gold, silver, stocks and other familiar assets while using crypto infrastructure and stablecoin settlements. This is a new direction this year that many cryptocurrency exchanges are actively rolling out.
The shift in user behavior on crypto exchanges is no less significant: stablecoins are increasingly being used not as a temporary vehicle for a trade but as a permanent way to store capital. The study says that 30% of users now hold more than half of their portfolio in stablecoins, compared with only 4% in 2020. The total market capitalization of the global stablecoin market has risen to roughly $311 billion versus $254 billion a year earlier, and the adjusted transaction volume in stablecoins, according to Visa's dashboard, reached a record $1.79 trillion in June, surpassing the previous peak recorded in February.
Against this backdrop, traditional money-transfer systems have already begun to respond: in May, Western Union launched its own stablecoin, USDPT, on the Solana blockchain, and in June, rival MoneyGram issued MGUSD on Stellar.
These trends fit into a broader picture being shaped by institutional players in recent months: Visa is developing its own stablecoin infrastructure for card top-ups and payouts to unbanked users; a consortium of more than 140 companies led by Visa, Stripe, Mastercard, and BlackRock is launching a single stablecoin, Open USD; and DTCC is preparing for a limited launch of tokenized securities in July 2026 with an expansion in October.
Taken together, these data confirm the main thesis: the digital-asset market is moving forward, and stablecoins are turning into a 24/7 system of money.
Trading recommendations
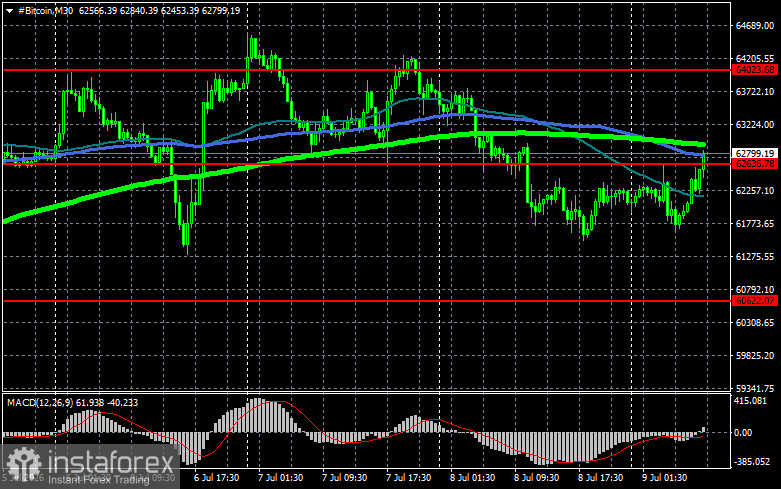
Bitcoin
Buyers are currently targeting a return to $62,600, which would open a direct path to $64,000, and from there it's a short step to $65,500 — breaching that level would signal attempts to revive the bull market. On the downside, I expect buyers around $60,600. A move back below that area could quickly push BTC toward $58,500. The furthest target on the downside would be around $56,100.
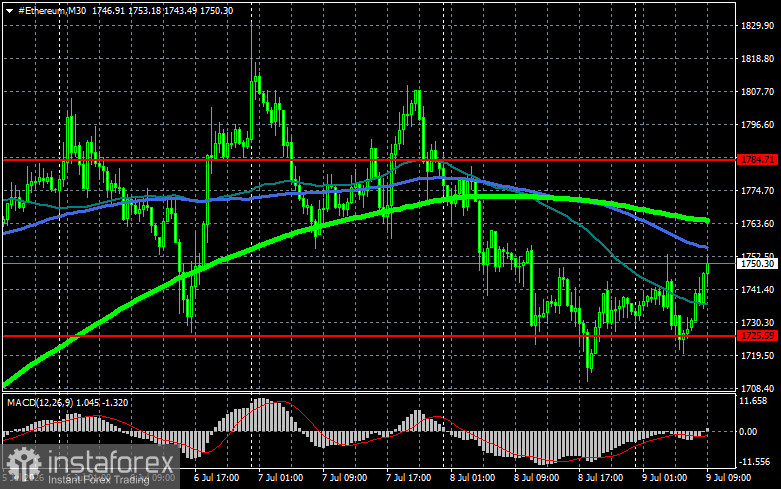
Ethereum
A clear hold above $1,784 would open a direct path to $1,838. The farther target is the high near $1,901; breaking above that would indicate strengthening bullish sentiment and a return of buyer interest. On the downside, I expect buyers at $1,725. A drop back below that area could quickly push ETH toward $1,650. The furthest downside target would be around $1,573.
What's on the chart
Price testing or crossing any of these moving averages often either halts movement or injects fresh momentum into the market.
InstaForex analytical reviews will make you fully aware of market trends! Being an InstaForex client, you are provided with a large number of free services for efficient trading.


