 Stay
Stay 
Trading Conditions
Products
Tools



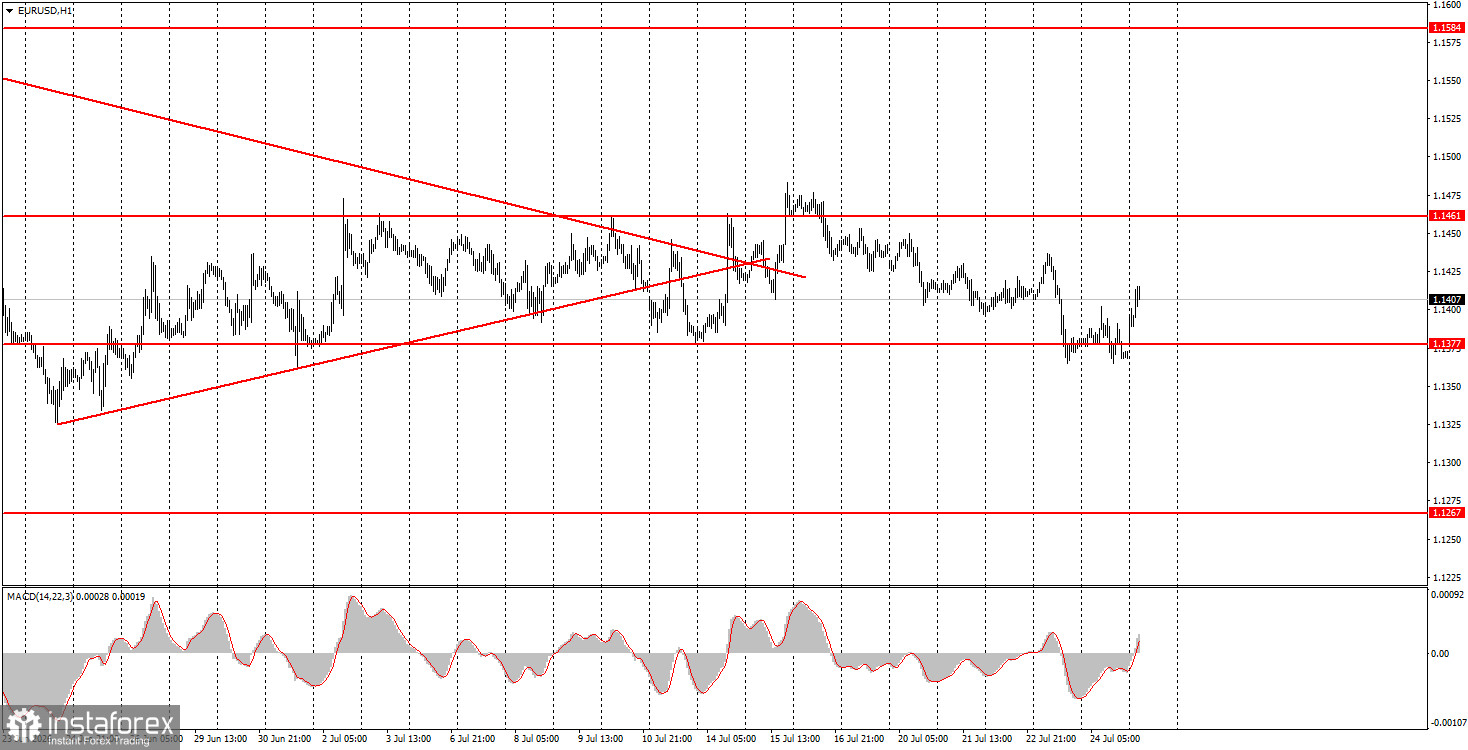
The EUR/USD pair attempted to continue its decline during trading on Friday but failed for the second time to break through the area of 1.1363-1.1377, which is the lower boundary of the sideways channel. As a result, another bounce from this area occurred, allowing us to expect movement towards the upper boundary of the flat that has lasted for a month and is clearly visible on the hourly chart. On Friday, the euro had every reason to show growth, just as it did the day before. Recall that the European Central Bank meeting held on Thursday can generally be considered "neutral-hawkish." In simpler terms, the ECB maintained a hawkish stance and expressed its readiness to continue tightening monetary policy. However, for the second consecutive time, the market ignored this factor. On Friday, the business activity indexes in the service and manufacturing sectors of the eurozone and Germany showed quite high values, which could also have prompted growth in the European currency. But the euro only increased overnight on Monday, when it became known that America had halted attacks on Iran and that the conflicting parties might return to the negotiating table soon.
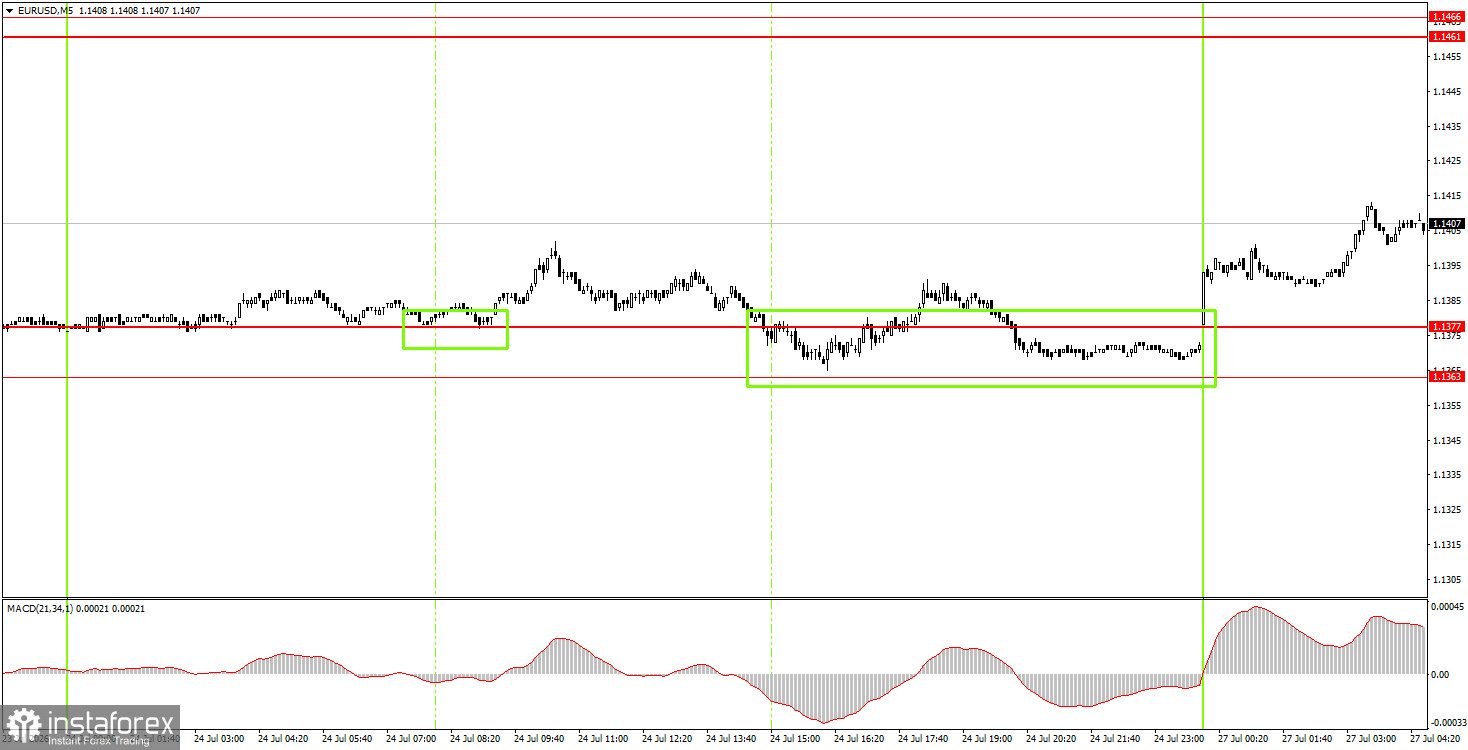
On the 5-minute timeframe, two buy trading signals were formed on Friday. The price bounced twice from the area of 1.1363-1.1377, and on Monday began moving upward. We expect this upward movement to continue this week.
On the hourly timeframe, both trend lines have been broken and are no longer relevant. Considering all events and market movements over the last few months, we believe the euro should begin a strong rise. However, the movements in recent weeks have been sideways. The market continues to ignore all factors in favor of the euro.
On Monday, novice traders may open short positions targeting 1.1267-1.1275 if the price consolidates below the area of 1.1363-1.1377. Long positions can be maintained after the two buy signals on Friday, targeting 1.1461-1.1466. Volatility may again be low today.
On the 5-minute timeframe, levels to consider include 1.1267-1.1275, 1.1363-1.1377, 1.1461-1.1466, 1.1527-1.1531, 1.1584-1.1594, 1.1655-1.1666, and 1.1745-1.1754. On Monday, a business climate report will be released in Germany, while the US will publish data on durable goods orders. Both reports are not significant and are unlikely to affect the current technical picture of the currency pair.
Price levels (areas) of support and resistance are targets when opening long or short positions or sources of signals.
Red lines indicate channels or trend lines that display the current trend and indicate the preferred direction for trading.
The MACD indicator (14,22,3) – histogram and signal line – is a supplementary indicator that can also be used as a source of signals.
Important speeches and reports (contained in the news calendar) can significantly impact the movement of the currency pair. Therefore, during their release, trading should be conducted with maximum caution, or one should exit the market to avoid sharp reversals against preceding movements.
Beginners trading in the forex market should remember that not every trade can be profitable. Developing a clear strategy and practicing money management are key to long-term success in trading.
InstaForex analytical reviews will make you fully aware of market trends! Being an InstaForex client, you are provided with a large number of free services for efficient trading.


