 Stay
Stay 
Trading Conditions
Products
Tools

The index was under a buying interest across the board, pushing higher above the 200 SMA on the H1 chart. Currently, it is targeting the resistance level of 94.58, at which lies a key barrier for buyers. With a pullback below 93.35, we can expect a leg lower towards the psychological level of 93.00. The MACD indicator remains in the positive territory.
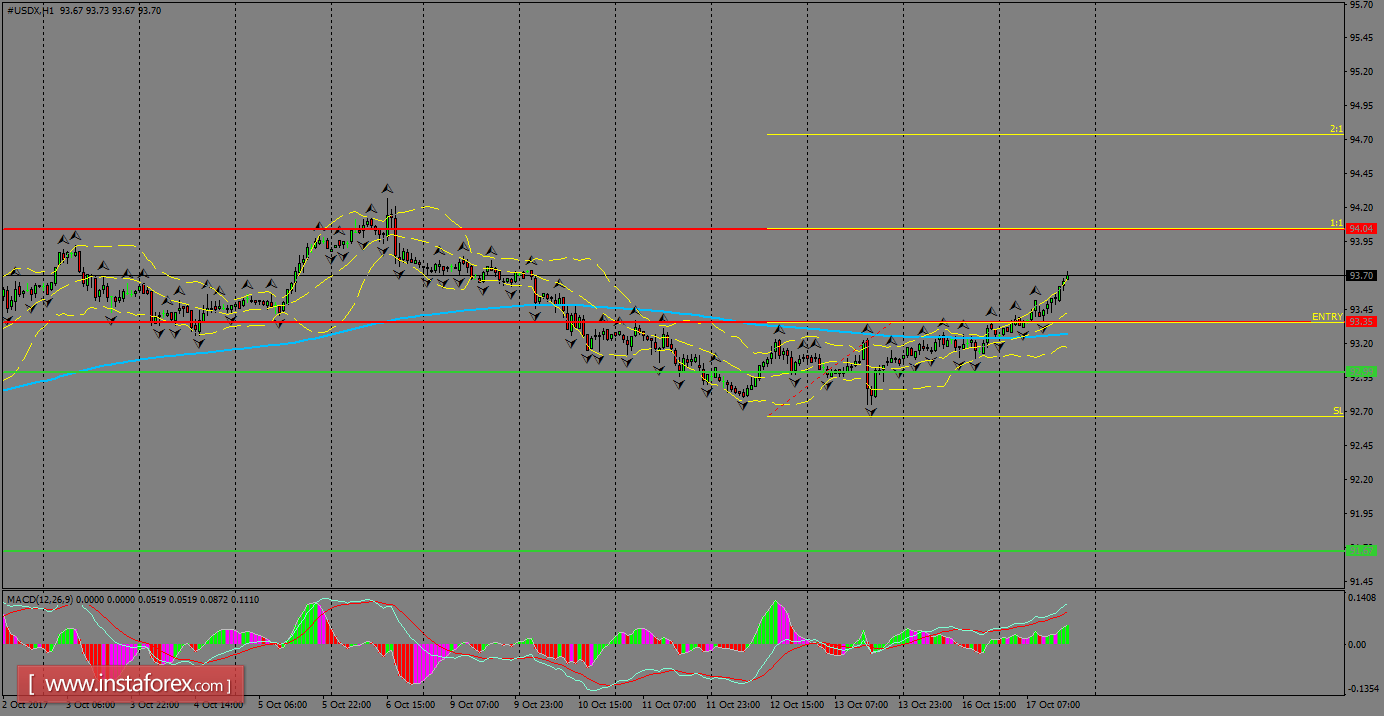
H1 chart's resistance levels: 93.35 / 94.58
H1 chart's support levels: 93.00 / 91.67
Trading recommendations for today: Based on the H1 chart, place buy (long) orders only if the USD Index breaks with a bullish candlestick; the resistance level is at 93.35, take profit is at 94.58 and stop loss is at 92.66.
InstaForex analytical reviews will make you fully aware of market trends! Being an InstaForex client, you are provided with a large number of free services for efficient trading.


