 Stay
Stay 
Trading Conditions
Products
Tools

The pair is struggling to consolidate above the psychological level of 1.3200 and it's expected to remain below the 200 SMA at H1 chart. If it manages to break below October 12 lows, it's likely to see a decline towards the support zone of 1.3037. To the upside, the nearest resistance is offered by the moving average mentioned above.
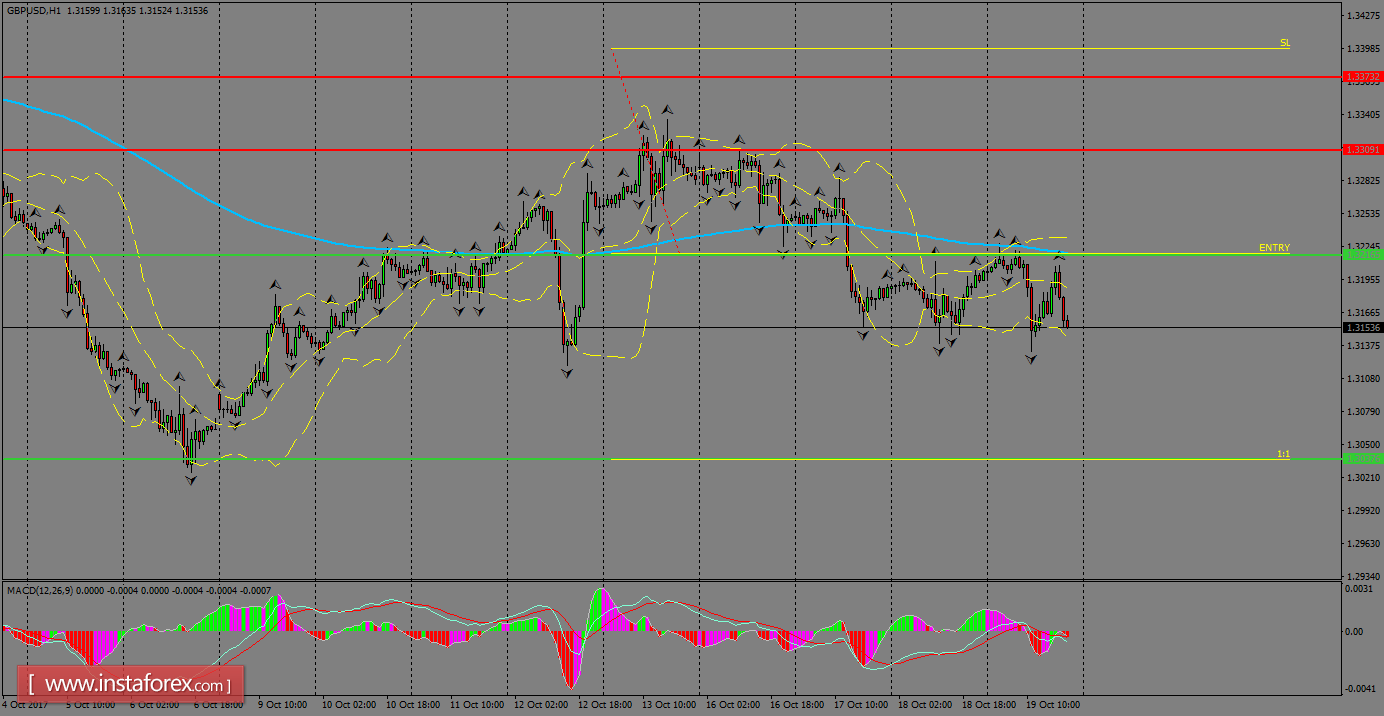
H1 chart's resistance levels: 1.3309 / 1.3373
H1 chart's support levels: 1.3216 / 1.3037
Trading recommendations for today: Based on the H1 chart, sell (short) orders only if the GBP/USD pair breaks a bearish candlestick; the support level is at 1.3216, take profit is at 1.3037 and stop loss is at 1.3398.
InstaForex analytical reviews will make you fully aware of market trends! Being an InstaForex client, you are provided with a large number of free services for efficient trading.


