 Stay
Stay 
Trading Conditions
Products
Tools

The index is still moving in sideways across the board, supported by the 200 SMA, according to our H1 chart's projection. The resistance zone of 95.14 is giving an offer to the price action, but if that level gets broken, then we might expect a leg higher to test the resistance zone of 95.85. MACD indicator remains in the neutral territory, showing the sideways situation in USDX.
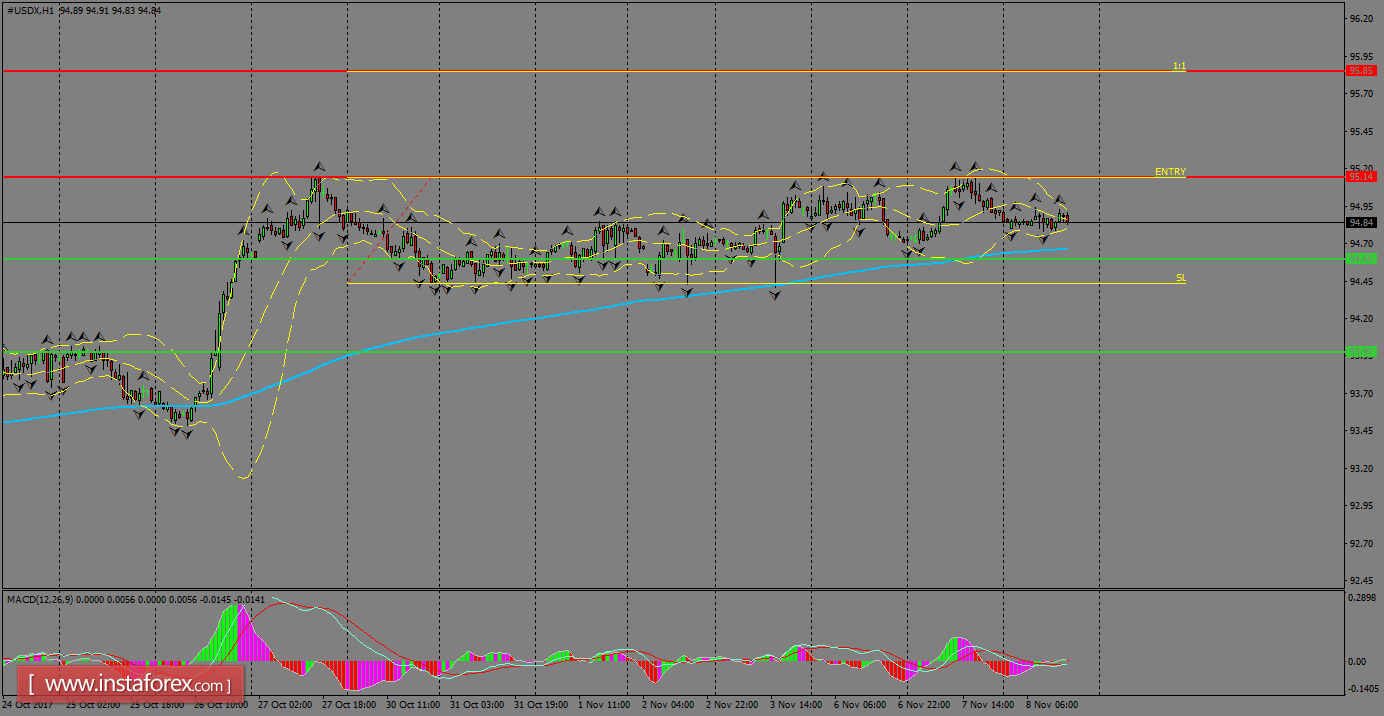
H1 chart's resistance levels: 95.14 / 95.85
H1 chart's support levels: 94.60 / 93.97
Trading recommendations for today: Based on the H1 chart, place buy (long) orders only if the USD Index breaks with a bullish candlestick; the resistance level is at 95.14, take profit is at 95.85 and stop loss is at 94.47.
InstaForex analytical reviews will make you fully aware of market trends! Being an InstaForex client, you are provided with a large number of free services for efficient trading.


