 Stay
Stay 
Trading Conditions
Products
Tools


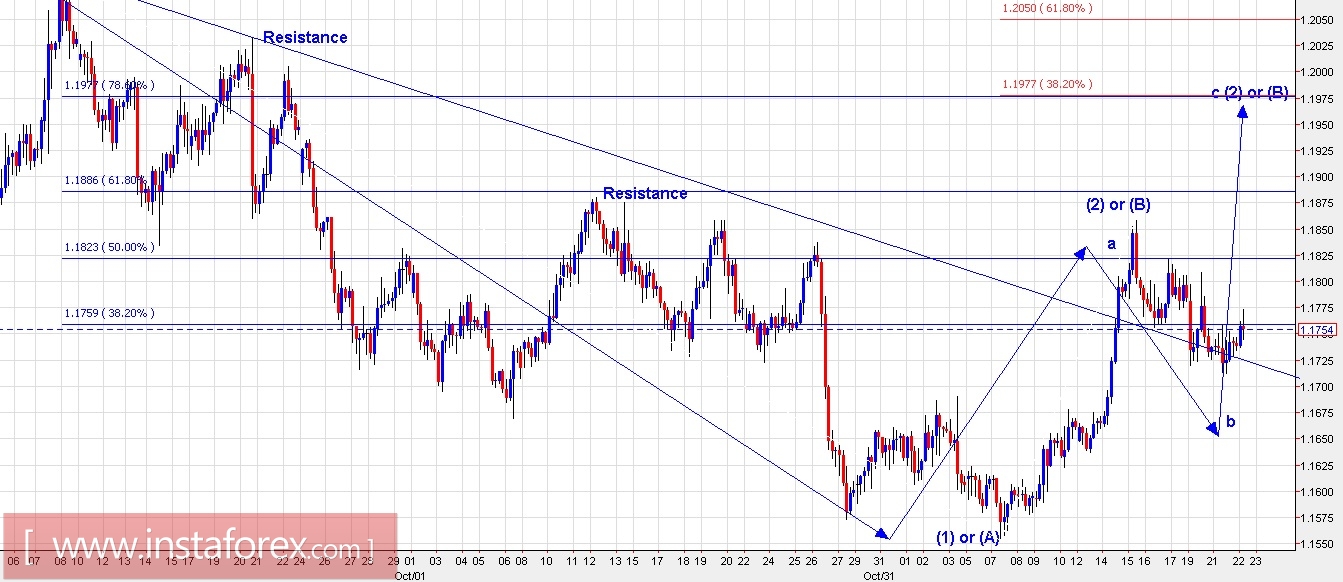
Technical outlook:
The EUR/USD continues to drift sideways/corrective manner and should soon be finding a bottom around 1.1670/80 levels as we have been discussing lately. Please note that the drop from here could be very swift and prices should not stay there for more time and that the rebound could be very sharp. The overall wave structure favors a 5-3-5 or a 3-3-5 larger correction that began from 1.2092 levels earlier. An immediate gartley structure indicates that EUR/USD should rally towards 1.1950/70 levels from 1.1670/80 levels or so. Price resistance is seen at 1.1880/1.1900 levels while support is seen at 1.1550 levels respectively. We are expecting a short term dip and then rally in the above counter.
Trading plan:
Please look to buy around 1.1670/80 levels, with risk at 1.1550 and target 1.1970.
US Dollar Index chart setups:
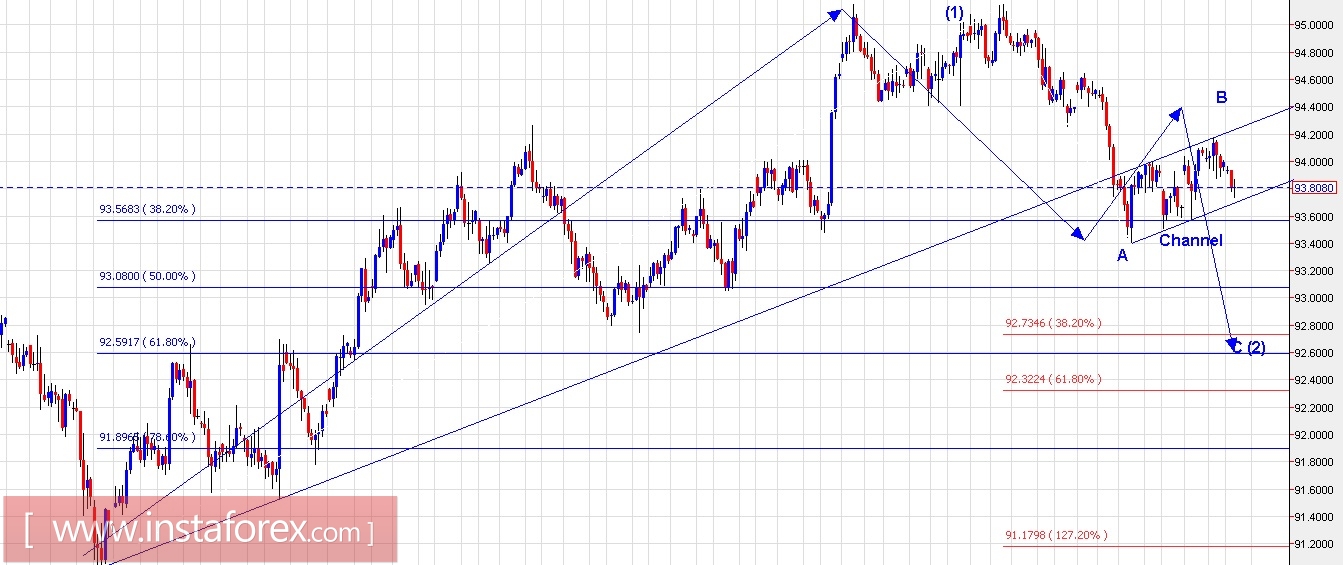
Technical outlook:
The US Dollar Index continues to drift in a rising channel since last several days, looking to find resistance around the 94.40/50 levels as wave B termination point highlighted here. Price may move swiftly towards 94.40/50 levels before dropping lower again towards 92.60/93.00 levels respectively. The overall wave structure is indicating a 5-3-5 corrective structure in the making since bottom formation around 91.00 levels earlier. Also please note that the correction could last longer and push higher towards 98.00/99.00 levels going forward. This chart is a wonderful case study for an up Gartley i the making. Price resistance is seen through 95.15 levels while support comes strongly around 92.80 levels respectively.
Trading plan:
Please look to sell around 92.40/50, stop 95.15 and target 92.60
Fundamental outlook:
Please watch out for USD Durable goods at 0830 AM EST.
Good luck!
InstaForex analytical reviews will make you fully aware of market trends! Being an InstaForex client, you are provided with a large number of free services for efficient trading.


