 Stay
Stay 
Trading Conditions
Products
Tools


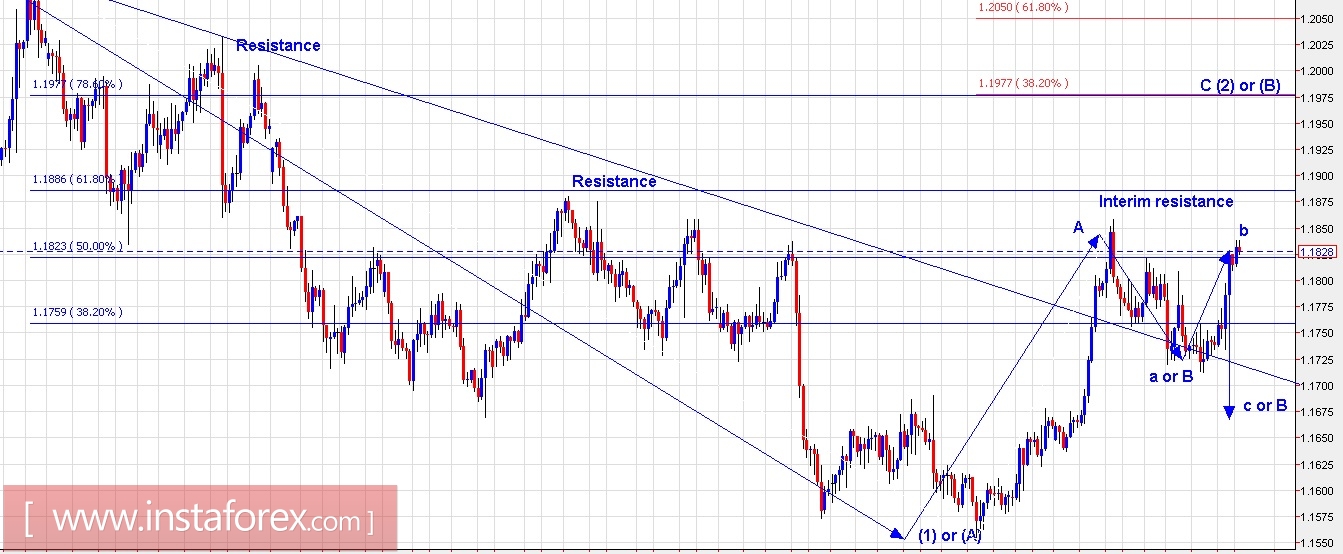
Technical outlook:
The EUR/USD pair posted an interesting rally yesterday and it's good we exited short positions earlier. At the same time, the long entries or positions were also not triggered at 1.1670/80 levels as expected, rendering us to remain flat. Believe it or not, the story still remains well poised to drop lower from here, until prices remain below 1.1860 levels. As depicted on the chart view here, the pair could still drop to 1.1670/80 levels, complete the counter trend, and then rally towards 1.1970 levels. For this count to hold true, prices should remain below 1.1860/65 levels. On the flip side though, a push higher turns the short-term outlook towards higher levels, and push prices through 1.1970 before turning lower again. Resistance is seen at 1.1875/1.1900 levels, while support comes in at 1.1710 levels respectively.
Trading plan:
Aggressive traders would want to remain short with risk above 1.1860 levels, targeting 1.1670 levels.
US Dollar Index chart setups:
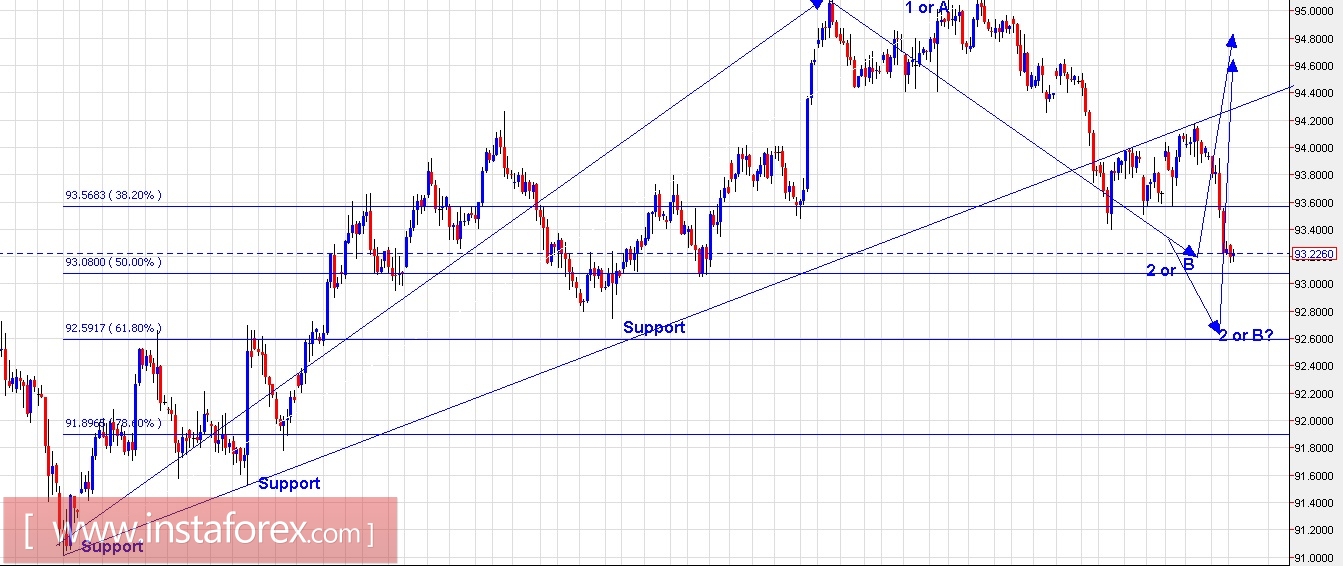
Technical outlook:
The US Dollar Index chart setups still look to be good on the long side. The index dropped lower towards almost 93.15 levels yesterday before pausing. The current wave count and structure is bringing us closer to our larger trade scenario where an upward gartley was in the making, which could push prices lower towards 92.68 and 93.00 levels respectively. Please note that the fibonacci 0.618 support of the rally between 91.00 through 95.10 levels is passing through 92.60 levels and that should remain a strong support going forward. Furthermore, bullish divergence scenarios have started to appear on short term timeframes as well, indicating that a bottom is very close. Immediate support is seen through 93.00 levels while resistance is at 94.20 now.
Trading plan:
Please remain partial long now and remaining around 92.60/80 levels, stop at 91.00 and target 98.00.
Fundamental outlook:
Please watch out for GBP Gross Domestic Product in about 04:30 AM EST
Good luck!
InstaForex analytical reviews will make you fully aware of market trends! Being an InstaForex client, you are provided with a large number of free services for efficient trading.

