 Stay
Stay 
Trading Conditions
Products
Tools

The pair stayed in a sideways range, supported by the 1.3303 level across the board. The 200 SMA at H1 chart still offers a dynamic resistance and it should help to push lower to GBP/USD in order to ride a bearish trend towards the 1.3228 level. However, as long as it remains above 1.3228, our bullish outlook will be untouched.
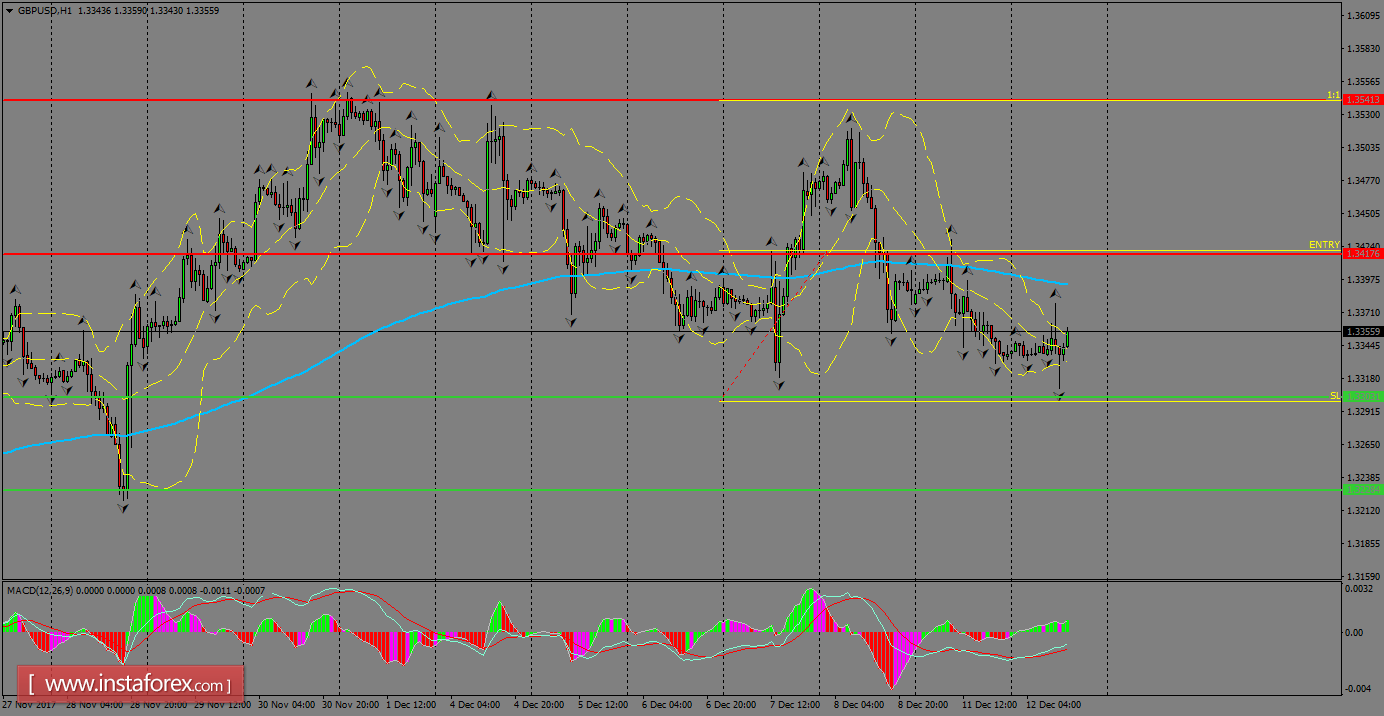
H1 chart's resistance levels: 1.3417 / 1.3541
H1 chart's support levels: 1.3303 / 1.3228
Trading recommendations for today: Based on the H1 chart, buy (long) orders only if the GBP/USD pair breaks a bullish candlestick; the resistance level is at 1.3417, take profit is at 1.3541 and stop loss is at 1.3298.
InstaForex analytical reviews will make you fully aware of market trends! Being an InstaForex client, you are provided with a large number of free services for efficient trading.


