 Stay
Stay 
Trading Conditions
Products
Tools

There is a bearish breakout underway around the 200 SMA at H1 chart, which should allow another leg lower towards the support zone of 1.3451. However, the risk to the upside remains high and the nearest resistance lies at 1.3589. The moving average should act as a dynamic support in order to strengthen the bulls in the short term.
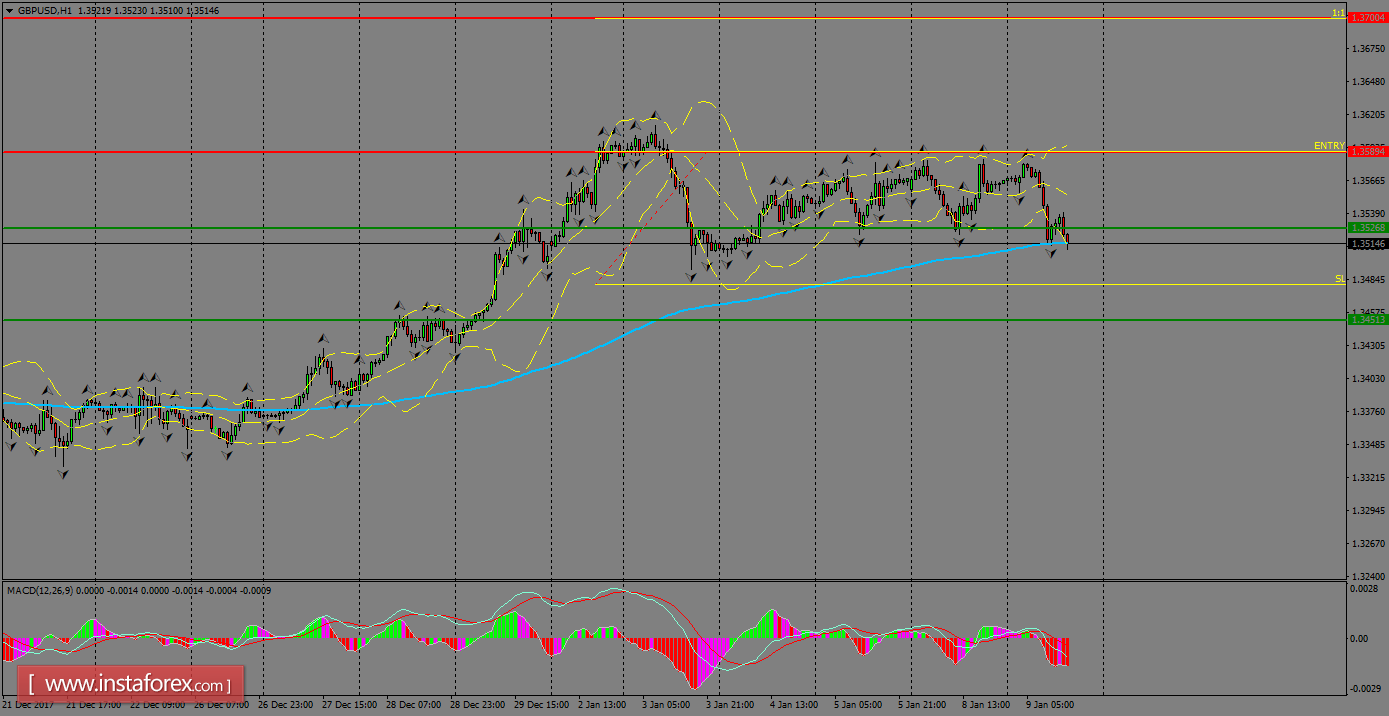
H1 chart's resistance levels: 1.3589 / 1.3700
H1 chart's support levels: 1.3526 / 1.3451
Trading recommendations for today: Based on the H1 chart, place buy (long) orders only if the GBP/USD pair breaks a bullish candlestick; the resistance level is at 1.3589, take profit is found at 1.3700 and stop loss lies at 1.3480.
InstaForex analytical reviews will make you fully aware of market trends! Being an InstaForex client, you are provided with a large number of free services for efficient trading.


