 Stay
Stay 
Trading Conditions
Products
Tools

USDX is in a recovery phase since January 25th and it seems we could expect a leg higher to test the 200 SMA at the H1 chart. That move could help to strengthen the bearish bias for the short-term because if the index manages to do a pullback around the moving average, it could be on the way to test the support zone of 89.36.
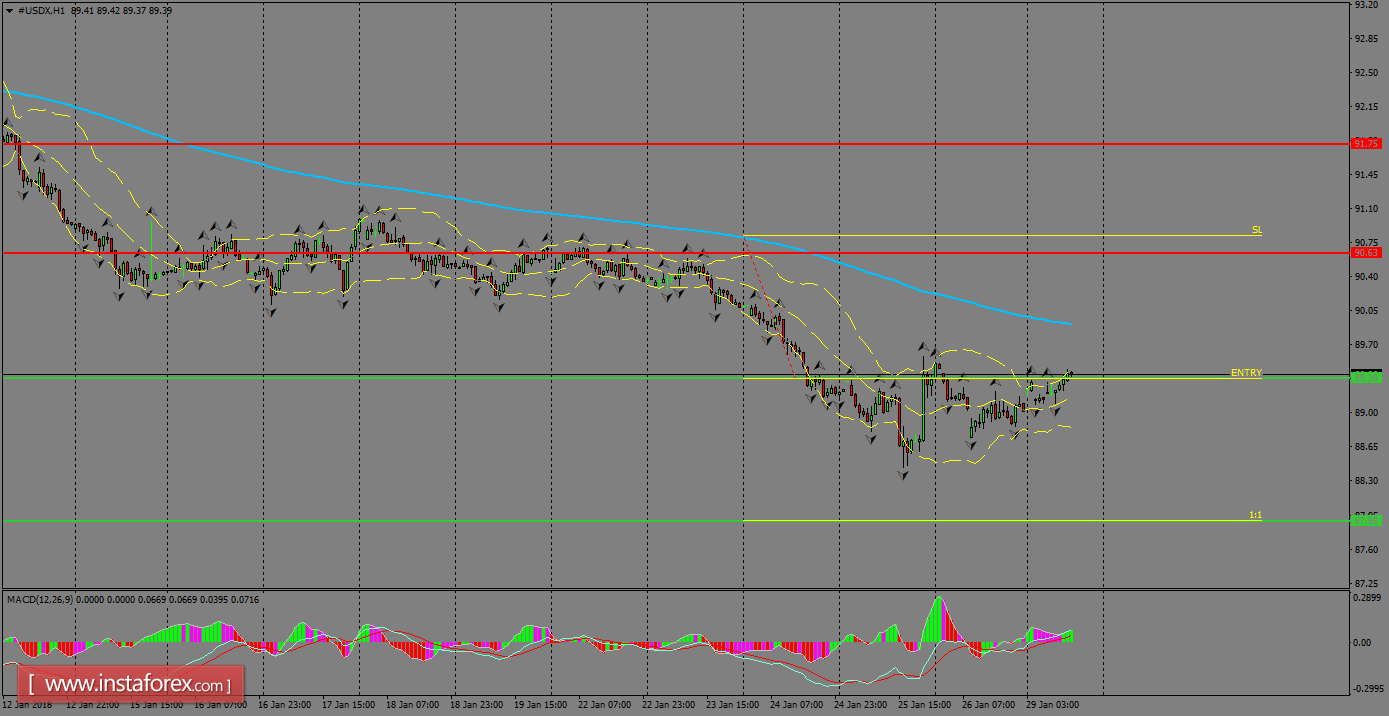
H1 chart's resistance levels: 90.63 / 91.75
H1 chart's support levels: 89.36 / 87.88
Trading recommendations for today: Based on the H1 chart, place sell (short) orders only if the USD Index breaks with a bearish candlestick; the support level is at 89.36, take profit is at 87.88 and stop loss is at 90.81.
InstaForex analytical reviews will make you fully aware of market trends! Being an InstaForex client, you are provided with a large number of free services for efficient trading.


